Download

1 / 24
240 likes | 357 Views
Monitoring and Modeling with StreamFS. Jorge Ortiz University of California, Berkeley. Building energy consumption highly fragmented. Building Management System captures Heat/cooling and ventilation Lighting systems Miscellaneous electrical loads Weather data, price, etc.

E N D
Monitoring and Modelingwith StreamFS Jorge Ortiz University of California, Berkeley
Building energy consumption highly fragmented • Building Management System captures Heat/cooling and ventilation • Lighting systems • Miscellaneous electrical loads • Weather data, price, etc. • Integration is key HVAC: 31.4% + 01/13/11
Why integrate? • Fault detection study[Schein2005] • Fault: Simultaneous heating and cooling • Controllers on separate schedules Heating coil valve Position varies Outside-air mixer Position varies Cooling coil remains off
Integration helps deduceactivity • Human-activity classification • Electrical activity [Patel2007] • HVAC air pressure [Patel2008] • Water usage[Froehlich2008] • IP traffic and circuit-level activity [Kim2010] • SmartThermostat[Lu2010] • Combines motion sensors and contact switches to reduce HVAC energy consumption by 28%
Integration With Current Systems is Hard
Commercial BMS Architecture Applications Routing/Controllers Field Level
Problems with BMS’s • Not designed to collect all the data • Memory limit at control layer, application layer • Most information is lost through sense-point “bundling” (averaging) • Burden on operator to manage • Must decide which signals to “trend/unbundle”, monitor (set trigger) • Leads to missing data in aggregate reports • Multi-signal fault detection done by human operator
The world is a nasty place • State-of-art not designed for data collection • 30% of sensors are broken[BEMS2000] • Mixed air reading errors +2.8 Celsius increases cooling energy consumption by 60% [Kao1983] • Mixed are reading errors -2.8 Celsius increases heating energy consumption by 30% [Kao1983] • Sensor data has fundamental problems • Data missing, variable production rate, calibration necessary, multidimensional, etc [Balazinska2007]
What do we want to achieve? • Generality • Supports the integration of many input/output sources • Ease of use • Add/remove input sources, add/remove output targets • Querying/Cleaning/Sharing the data • Use the metadata to make more informed queries • Organizing principle: Everything looks like a distributed file system • Hierarchy restricts data access through naming • Useful for accessing data according to semantic, categorical, or physical placement
Building multiview integration Environment and Activity /SodaHall /hvac /loadtree /spaces /xform /Chiller /CT /panel /floor4 /floor3 Electrical Load Tree Climate plant
Organizing the metadata r-node {“desc”:”Acme” “timestamp”: …} s-node {“desc”:”Outlet” “timestamp”: …} { “desc”:”inventory inside SDH” “timestamp”: … } {“desc”:”Phone” “timestamp”: …} /inventory {“desc”:”Lamp” “timestamp”: …} /mote123 /SodaHall /power /hvac /loadtree /spaces /xform /Chiller /CT /panel /floor4 /floor3 /outlet /vent
Data collection and querying GET /SDH/spaces/*?query=true&props_metertype=powermeter /inventory/mote123 { “metertype”:”powermeter”, “desc”:”Electric power meter”, “timestamp”: 1290500046 } /par /hum /temp /power PID2 PID1 PID3 PID4 GET ?query=true&ts_timestamp=gt:now-100,ls=now PID4 PID1 PID3 PID2 DB Time
Data representation layer / # list resource under URI root [GET] /data # list sense points under resource data [GET] / [sense_point] # select a sense points [GET] /meter # meters provide this service [GET] / [channel] # a particular channel [GET] /reading # meter reading [GET] /format # calibration and units [GET/POST] /parameter # sampling parameter [GET/POST] /profile # history of readings [GET] /report # create and query periodic reports [GET/POST] sMAP Geographical Water Electrical Occupancy Physical Information Environmental Weather Structural Actuator • Narrow-waist for data representation • Simple Metering and Actuation Profile (sMAP)
RESTful + JSONInterface POST http://is4server.com/is4/devices/ mote123/power?pubid=550e8400 PUT http://is4server.com/is4/devices/mote123/ { "Reading": 120, } { "operation":"create_publisher", "resourceName”:”power" } GET http://is4server.com/is4/devices/ mote123/power REPLY: 201 Created { ”pubid":"550e8400", } { “desc”:”Temperature mote”, "Reading": 120, “timestamp”: 1290500046 } PUT http://is4server.com/is4/devices/mote123/power
Sharing real-time feeds StreamFS mote123/power POST http://is4server.com/sub 550e8400 price { "streams":[550e8400], "url":"http://128.32.37.21:8011/sub.php" } BMS Zigbee 41d4 POST REPLY: 201 Created { ”subid":"41d4", } http://128.32.37.21:8011/sub.php http://is4server.com/sub/41d4
y x y x Standard distillationelements User Consistentuniform view Apply regression; Compute “temp” at grid points Provide regression, interpolation, extrapolation functions over space and time values Provide join and filter functions Related work: MauveDB[Deshpande2006]
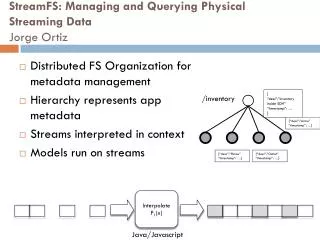
Data cleaning and distillation staging Interpolate F1(x) Java/Javascript Extrapolate F2(x) /models /inventory/mote123 /interp /filter /power /current /inventory/mote123/power | /models/interp| /models/filter |http://128.32.37.21:8011/sub.php /proc_chains/983hfq
Model resource example { winsize:10, materialize:true, timeout:2000, func:function(istream){ varostream = new Object(); var sum =0; for(i=0; i<istream.length; i++){ var data = istream[i]; sum += data.Reading; } ostream.points = istream.length; ostream.avg = sum/istream.length; return ostream; } }
Putting it all together(1) GET /…/floor4/room410/*/*?query=true&prop_type=temp /floor4 Interpolate F1(x) Interpolate F1(x) /room410 /mote01 /therm /…/floor4/room410/room410/mote01/temp /…/floor4/room410/room410/therm/temp /temp /temp /…/floor4/room410/room410/mote01/temp?query=true&ts_timestamp=lte:t1,gte:t7 /…/floor4/room410/room410/therm/temp?query=true&ts_timestamp=lte:t1,lte:t7
Putting it all together (2) In-time pipe-chain Continuous pipe-chain t1 /…/floor4/room410/*/*?query=true&type=device | /models/ts_getall?ts_timestamp=lte:t1,gte:t7 |/models/interp_all?attr=timestamp&unit=1 | /models/join?attr=timestamp | http://viewer.com/viewer.php mote01/temp therm/temp t2 t3 t4 t5 t6 t7
Current Status • Live instance on is4server.com • 2795 Incoming data streams • ~600 Kbps incoming data rate • Releases available on the site • Version 2.0 with modeling to be released soon • Documentation and tutorial available on is4server.com • Used in various applications • Electrical load tree viewer, metadata graph viewer, SDH Energy Audit application
Future work • Inter-system cross-signal correlation • Build usage/fault signatures to detect inefficient energy-use detection • How do we expand the use of StreamFS beyond buildings? • Energy analytics • Building blocks available, how do we use it?
Feedback/Questions? Jorge Ortiz <jortiz@cs.berkeley.edu>