Download
1 / 7
80 likes | 219 Views
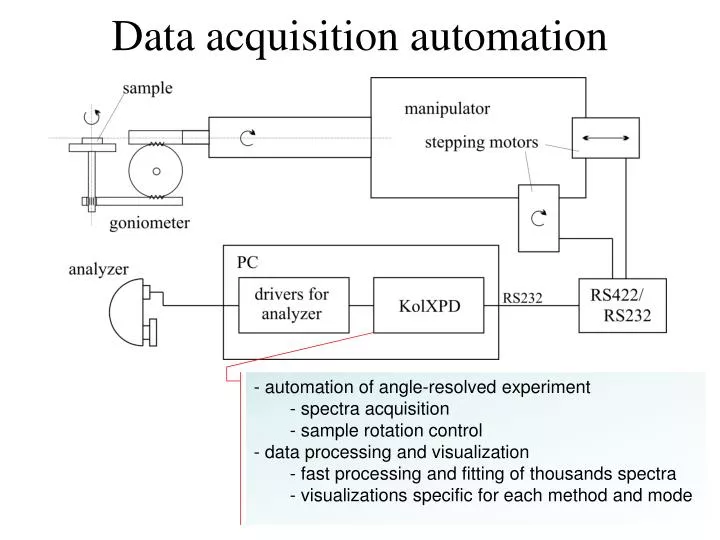
Data acquisition automation. automation of angle-resolved experiment spectra acquisition sample rotation control data processing and visualization fast processing and fitting of thousands spectra visualizations specific for each method and mode. KolXPD & X-ray photoelectron diffraction.

E N D
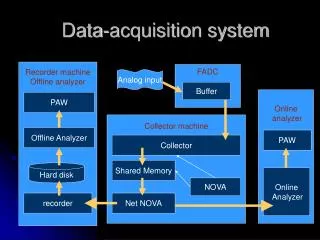
Data acquisition automation • automation of angle-resolved experiment • spectra acquisition • sample rotation control • data processing and visualization • fast processing and fitting of thousands spectra • visualizations specific for each method and mode
KolXPD & X-ray photoelectron diffraction • Angle resolved spectra can be fitted • all angular points are automatically fitted • any parameter of the fit or an expression of them can be drawn in scan chart or 2D-pattern view tree view of multiple experiments spectra for each angle step (multiple regions in one step) polar or azimuthal scans of XPD pattern 2D view of XPD pattern (Cartesian or polar)
Acquisition modes of ARUPS measurements Angular-dependent UPS spectra Constant-energy maps UV RTG sample Analyser Polar scans Azimuthal scans
Example of displaying ARUPS data set of UPS spectra 2D map B.E. vs. polar angle 2D map B.E. vs. k|| image processing
Image processing of ARUPS data max acquired data min color mask of orig. intensity X-normalization Fermi edge compensation high-pass filter color mask overlay
KolXPD: Other capabilities • measurements of methods using variable photon energy(NEXAFS, resonant photoemission, etc.)at MSB beamline (synchrotron Elettra in Trieste, ITA) • fast processing and visualization of standard photoemission data (XPS, UPS and SRPES methods) • import of result of XPD-pattern simulations (software EDAC*) • simple quantitative analysis • import and export of many file-formats Author: Jiří Libra, Jiri.Libra@gmail.com * F. J. García de Abajo, M. A. Van Hove, C. S. Fadley, Phys. Rev. B 63 (2001) 75404.