Download
1 / 8
80 likes | 147 Views
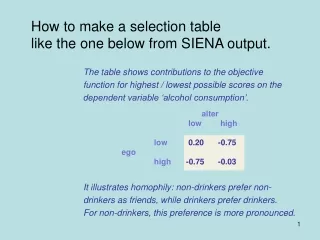
How to make a selection table like the one below from SIENA output. The table shows contributions to the objective function for highest / lowest possible scores on the dependent variable ‘alcohol consumption’. It illustrates homophily: non-drinkers prefer non-

E N D
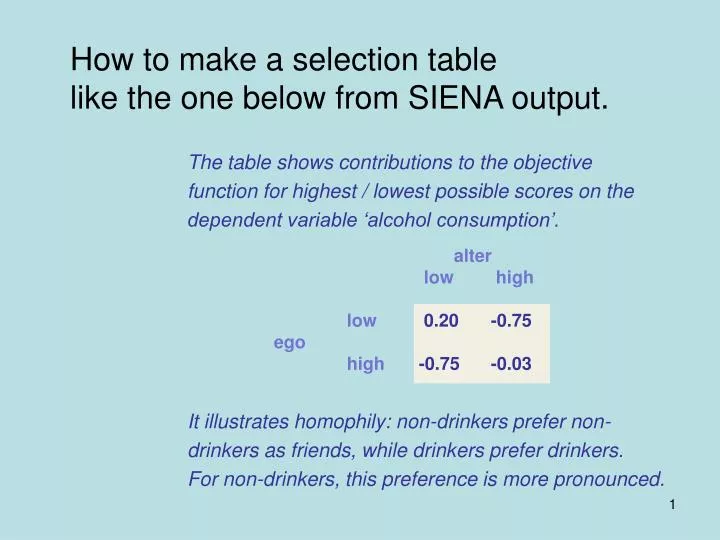
How to make a selection table like the one below from SIENA output. The table shows contributions to the objective function for highest / lowest possible scores on the dependent variable ‘alcohol consumption’. It illustrates homophily: non-drinkers prefer non- drinkers as friends, while drinkers prefer drinkers. For non-drinkers, this preference is more pronounced. • alter • low high • low0.20 -0.75 • ego • high-0.75 -0.03
SIENA output needed: (1) The estimates of the similarity, ego and alter effects in the network objective function: @2 Estimation results. ------------------- Regular end of estimation algorithm. Total of 5229 iteration steps. @3 Estimates and standard errors 1. l: constant network rate (period 1) 12.4476 ( 1.5410) 2. l: constant network rate (period 2) 9.5558 ( 1.0762) etc. 25. u: classical ego 0.4046 ( 0.1671) 26. u: alcohol similarity (centered) 0.8341 ( 0.2712) 27. u: alcohol alter -0.0297 ( 0.0398) 28. u: alcohol ego -0.0284 ( 0.0335) 29. u: behavior techno tendency 0.0126 ( 0.2482) etc.
SIENA output needed: (2) The range of the variable: Note that for actor covariates, the maximum and minimum values have to be taken after centring, and are not reported in the outputfile! Assess them from the data, and subtract the mean value reported in the output file. @2 Reading dependent actor variables. ---------------------------------- 1st dependent actor variable named TECHNO read from file C:\stocnet\temp\~GLr-techno.dat. etc. etc. 4th dependent actor variable named ALCOHOL read from file C:\stocnet\temp\~GLr-alc.dat. Value 0 is the code for missing data. Minimum and maximum rounded values are 1 and 5. A total of 4 dependent actor variables.
SIENA output needed: (3) The global average similarity on the variable: ... For the similarity variable calculated from each actor covariate, the mean is subtracted. These means are : Similarity gender : 0.5048 Similarity techno : 0.6484 Similarity rock : 0.7473 Similarity classical : 0.9305 Similarity alcohol : 0.6918 The mean balance dissimilarity value subtracted in the balance calculations is 0.054178 . etc.
How to proceed? (A) Make an ego-alter table:
How to proceed? (B) Centre similarity values:
How to proceed? (C1) Calculate sum of effects:
How to proceed? (C2) Calculate sum of effects: