Download
1 / 24
240 likes | 379 Views
PLASMA DYNAMICS AT THE IONIZATION FRONT OF HIGH PRESSURE DISCHARGES USING ELECTRON MONTE CARLO SIMULATIONS ON AN ADAPTIVE MESH* Ananth N. Bhoj a) and Mark J. Kushner b) a) Department of Chemical and Biomolecular Engineering University of Illinois, Urbana, IL, USA. Email: bhoj@uiuc.edu

E N D
PLASMA DYNAMICS AT THE IONIZATION FRONT OF HIGH PRESSURE DISCHARGES USING ELECTRON MONTE CARLO SIMULATIONS ON AN ADAPTIVE MESH* Ananth N. Bhoja) and Mark J. Kushnerb) a)Department of Chemical and Biomolecular Engineering University of Illinois, Urbana, IL, USA. Email: bhoj@uiuc.edu b)Department of Electrical and Computer Engineering Iowa State University, Ames, IA, USA. Email: mjk@iastate.edu http://uigelz.ece.iastate.edu Gaseous Electronics Conference, October 2006 * Work supported by the National Science Foundation.
OUTLINE Introduction: High Pressure Discharges Plasma Hydrodynamics Model Kinetic Model – eMCS on Adaptive Mesh Plasma Dynamics at the Ionization Front 100s Torr - Corona Discharges 10s Torr - Breakdown in cold HID lamps Summary Iowa State University Optical and Discharge Physics GEC06_agenda
PLASMA DYNAMICS AT THE IONIZATION FRONT The ionization front during breakdown at high pressure (10s Torr to 1 atm) is a region of high E/N (100s Td) having steep gradients. Large “confined” E/N produces large Te and ionization rates. Though high pressure discharges are collisional, these gradients may be so severe (few Td/mm) that electron transport can be non-local. Iowa State University Optical and Discharge Physics ANANTH_GEC06_01
MODELING OF PLASMA DYNAMICS AT THE IONIZATION FRONT Non-local transport in ionization fronts can be expected when For these conditions both high spatial resolution and kinetic transport of electrons are required. Two-dimensional (2D) plasma hydrodynamics models employing fluid techniques typically do not capture non-local effects. To address these conditions, a 2D kinetic electron Monte-Carlo simulation (eMCS) module within a fluid model was developed to track and resolve electron dynamics at the ionization front. Iowa State University Optical and Discharge Physics ANANTH_GEC06_02
2-D PLASMA MODELING PLATFORM Iowa State University Optical and Discharge Physics ANANTH_GEC06_03
ELECTROSTATICS, CHARGED PARTICLE TRANSPORT Fully implicit solution of Poisson’s equation. Continuity: Multi-fluid charged species equations using modified Scharfetter-Gummel fluxes. Surface charge on dielectric surfaces. 2-d unstructured mesh, finite volume methods, Newton integration. Iowa State University Optical and Discharge Physics ANANTH_GEC06_04
ELECTRON, NEUTRAL TRANSPORT, REACTION KINETICS Electron energy transport of bulk electrons: Neutral species updated in a time-spliced manner between updates to charged species. Reaction Kinetics include sources due to electron impact and heavy particle reactions, photoionization and contributions from secondary emission. Iowa State University Optical and Discharge Physics ANANTH_GEC06_05
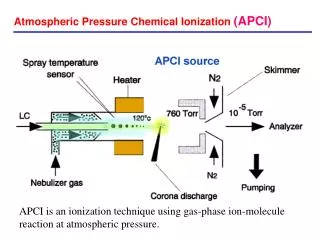
POSITIVE CORONA DISCHARGE Corona discharge as used for polymer surface treatment with a powered electrode (V0) 2 mm from a grounded plane. Air at 760 Torr, V0 = 15 kV Species: e, N2, N2*, N2+, N2**, N4+, N, N+, O2, O2+, O-, O2*, O2*(1S), O*, O(1S), H, OH. Iowa State University Optical and Discharge Physics ANANTH_GEC06_06
POSITIVE CORONA BREAKDOWN [e] cm-3E/N (Td) Te (eV) 5x10¹² - 5x10¹⁵ 30-3000 0 - 10 E/N is enhanced at the ionization front to 500-1000 Td. The enhanced E/N increases Te which rises at the front to 6 - 7 eV. In the ionized channel, E/N falls below 50 Td with Te = 0.5 -1 eV. [e] of 1013 cm-3 in channel. 150 mm MIN MAX 15 kV, 760 Torr, N2/O2/H2O=79/20/1, 5 ns Iowa State University Optical and Discharge Physics Animation Slide-AVI ANANTH_GEC06_07
NON-LOCAL ELECTRON TRANSPORT - eMCS Electron transport may become “non-local” due to large E/N (500-1000 Td) and severe gradients (1000s Td/mm). Kinetic approaches are required to obtain the electron energy distribution (EED), f(r,,t) in position and time to compute electron transport and reaction rates. Calculating f(r,,t) over the entire domain is computationally prohibitive. Our kinetic approach uses an electron Monte-Carlo simulation on smaller “regions of non-equilibrium” identified during the avalanche using “sensors”. Outside these regions, calculations proceed as before using the hydrodynamics equations. Iowa State University Optical and Discharge Physics ANANTH_GEC06_08
ADAPTIVE eMCS – SENSORS AND MESH Sensors identify regions on the unstructured mesh. • Te, ionization rates • E/N • (E/N) • [e] Combination of sensor outputs identify “non-equilibrium.” • Boundary of non-equilibrium region with superimposed rectilinear mesh For example, the non-equilibrium region in a positive corona can be tracked using [e] 1011 cm-3(E/N) 0.01 (E/N)max A rectilinear mesh is superimposed over non-equilibrium region upon which eMCS is performed. Iowa State University Optical and Discharge Physics ANANTH_GEC06_09
ADAPTIVE eMCS – PARTICLE LAUNCHING Pseudoparticles weighted by electron flux moving into the region are launched from edges to obtain f(r,,t) inside the region. Velocity of launched particles is the vector sum VT of vthermal at a randomly selected angle and the drift velocity vd. Edges of MCS mesh VT r = random number Iowa State University Optical and Discharge Physics ANANTH_GEC06_10
ADAPTIVE eMCS COUPLED TO HYDRODYNAMICS Trajectories of particles are integrated in time on the rectilinear mesh using interpolated electric fields to obtain f(r,,t). Using f(r,,t), electron energy and electron impact sources are calculated on the rectilinear mesh and interpolated back to unstructured mesh nodes for use in the hydrodynamic model. The Adaptive eMCS Module is called frequently enough to track the dynamics of the non-equilibrium region. Iowa State University Optical and Discharge Physics ANANTH_GEC06_11
POSITIVE CORONA: TRACKING THE FRONT (E/N) eMCS region 103 (Td/mm) Particle launch nodes eMCS mesh tracks regions of high (E/N). [e] > 1011 cm-3 (E/N) > 1% of max. Particles are launched from nodes on edges with a net influx of electrons to the region. eMCS called every 100 ps. 150 mm 15 kV, 760 Torr, N2/O2/H2O=79/20/1, 5 ns (E/N) 103 Td/mm 1 30 Iowa State University Optical and Discharge Physics Animation Slide-AVI ANANTH_GEC06_12
POSITIVE CORONA: Te eMCS At the ionization front, eMCS produce peak values of Te of 6 – 7 eV as it traverses the gap, about 1 eV higher than fluid model. Te (eV) 0 12 150 mm 15 kV, 760 Torr, N2/O2/H2O=79/20/1 Iowa State University Optical and Discharge Physics ANANTH_GEC06_13 Animation Slide-AVI
POSITIVE CORONA: IONIZATION SOURCES eMCS Maxima in electron impact ionization sources with eMCS are smaller than with fluid model. The higher Te and lower ionization sources indicate non-equilibrium in the EED at the front (cut-off tail). Ionization Sources (cm-3s-1) 1021 1025 150 mm 15 kV, 760 Torr, N2/O2/H2O=79/20/1 Iowa State University Optical and Discharge Physics Animation Slide-AVI ANANTH_GEC06_14
POSITIVE CORONA: ELECTRON DENSITY eMCS [e] density in the ionized channel 2 – 3 times lower with eMCS due to lower ionization sources. Width of channel is narrower and more in-tune with experimental observations. [e] (cm-3) 5x10¹² 5x10¹⁵ 150 mm 15 kV, 760 Torr, N2/O2/H2O=79/20/1 Iowa State University Optical and Discharge Physics Animation Slide-AVI ANANTH_GEC06_15
BREAKDOWN IN COLD HID LAMPS : 10s Torr Investigations into breakdown in a cylindrically symmetric lamp based on the experimental lamp geometry. 0.5cm Dielectric Powered electrode Plasma HEIGHT (cm) Air Quartz ELECTRODE GAP = 1.6 cm tube Dielectric Grounded Grounded housing electrode L RADIUS (cm) C Cylindrical center line Ar, 10s Torr, V0= 2000 V Species: e, Ar, Ar*, Ar**, Ar+, Ar2*, Ar2+. Iowa State University Optical and Discharge Physics ANANTH_GEC06_16
MINMAX TRACKING THE IONIZATION FRONT Te [e] [Sources] MCS 10 eV 1013 cm-3 1020 cm-3s-1 Ionization front with steep gradients in [e] and ionization sources moves across the gap. eMCS sensors are the ratios A second fixed eMCS mesh tracks secondary electrons emitted from the cathode due to photons, ion bombardment. Ar, 30 Torr, 2000 V, 400 ns Iowa State University Optical and Discharge Physics Animation Slide-AVI ANANTH_GEC06_17
EFFECT OF PRESSURE : Te 010 90 Torr 50 Torr 30 Torr 540 ns eMCS, 700 ns eMCS, 400 ns 1245 ns eMCS, 1585 ns 355 ns 5.5 6.4 5.0 6.1 *6.2 7.7 Te at the front decreases with increasing pressure due to lower E/N. Te from eMCS is 1.5 eV higher at 30 Torr, and 1 eV higher at 90 Torr. Te (eV) Animation Slide-AVI Ar, 2000 V Iowa State University Optical and Discharge Physics * Typical values at locations midway across the gap as avalanche passes by. ANANTH_GEC06_18
EFFECT OF PRESSURE : IONIZATION SOURCES 1017 1020 30 Torr 50 Torr 90 Torr eMCS eMCS eMCS *4.5 x 10¹⁹ 1 x 10¹⁹ 2.5 x 10¹⁹ 1.1 x 10¹⁹ 1.4 x 10¹⁹ 1.1 x 10¹⁹ eMCS sources are also lower, indicating some non-equilibrium in the EED, but is comparable to fluid model values at higher pressures. [Sources]cm-3s-1 Animation Slide-AVI Ar, 2000 V Iowa State University Optical and Discharge Physics * Typical values at locations midway across the gap as avalanche passes by. ANANTH_GEC06_19
EFFECT OF PRESSURE : ELECTRON DENSITY 109 1013 30 Torr 50 Torr 90 Torr eMCS eMCS eMCS 2.5 x 1011 *2.2 x 1011 2.3 x 10¹¹ 3.8 x 10¹¹ 1.0 x 10¹¹ 1.0 x 10¹¹ [e] density increases with pressure, but is lower with eMCS since ionization sources are lower. [e]cm-3 Animation Slide-AVI Ar, 2000 V Iowa State University Optical and Discharge Physics * Typical values at locations midway across the gap as avalanche passes by. ANANTH_GEC06_20
SUMMARY An eMCS was developed on adaptive meshes that track the ionization front of high pressure discharges using sensors. In corona discharges at 100s Torr, the kinetic approach using eMCS yields Te 1 – 2 eV higher at the front. eMCS calculated electron impact ionization sources have peak values lower by 3 – 5 times at the front, indicating non-equilibrium in the cut-off tail of the EED at these locations. Electron density in the channel behind the ionization front is lower with eMCS, but the channel is also narrower in extent. During breakdown in cold Ar-filled HID lamps at 10s Torr, Teat the front using eMCS are greater than fluid Te values but this difference diminishes as pressure increases. At constant pressure, ionization sources and electron density are lower by 2 – 3 with eMCS than fluid values. Iowa State University Optical and Discharge Physics ANANTH_GEC06_21
ADAPTIVE eMCS ALGORITHM FLOWCHART The Adaptive eMCS is called at time intervals frequent enough to track the dynamic ionization front. Iowa State University Optical and Discharge Physics ANANTH_GEC06_22