Download
1 / 35
350 likes | 476 Views
Forecasting Duration Intervals of Scientific Workflow Activities based on Time-Series Patterns. Xiao Liu, Jinjun Chen, Ke Liu, Yun Yang CS3: Centre for Complex Software Systems and Services Swinburne University of Technology, Melbourne, Australia

E N D
Forecasting Duration Intervals of Scientific Workflow Activities based on Time-Series Patterns Xiao Liu, Jinjun Chen, Ke Liu, Yun Yang CS3: Centre for Complex Software Systems and Services Swinburne University of Technology, Melbourne, Australia {xliu, jchen, kliu, yyang}@swin.edu.au
Content • Introduction • Time-Series Forecasting • Time-Series Patterns • Forecasting Duration Intervals of Scientific Workflow Activities based on Time-Series Patterns • Motivation • The Pattern Game • Evaluation • Conclusion
Time Series Forecasting A time series is a set of observations made sequentially through time. Marketing time series Temperature time series System performance time series Time-series forecasting is to predict the likely outcome of the time series in the near future, given knowledge of the most recent outcomes CPU load, network load, activity durations What’s this time series about, mind taking a guess? AUD/USD (1 day in 1 year): from www.xe.com
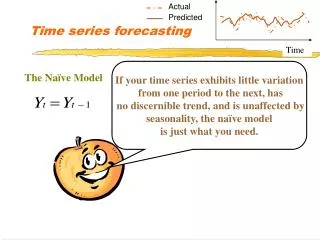
Time Series Forecasting Homer Simpson’s forecasting line It was on the rise, but who knows the crises #%#&…
Time Series Pattern A pattern is a type of theme of recurring events or objects which repeats in a predictable manner Time series patterns can be regarded as a set of time series segments which re-occurs in a statistic sense
Introduction Time-Series Forecasting Time-Series Patterns Forecasting Duration Intervals of Scientific Workflow Activities based on Time-Series Patterns Motivation Pattern Based Time-Series Forecasting Strategy Evaluation Conclusion Where Are We 6
Motivation Scientific workflow activity durations are important for scientific workflow scheduling, temporal verification and many other time related QoS functionalities From the initial job submission to the final completion, comprising the execution time and vast scientific workflow overheads: data transfer overheads, middleware overheads, loss of parallelism overheads and etc*. Dynamic performance of underlying infrastructures, e.g. grid computing, peer to peer, cloud computing… * R. Prodan and T. Fahrigne, Analysis of Scientific Workflow Overheads in Grid Environments, TPDS, 2008)
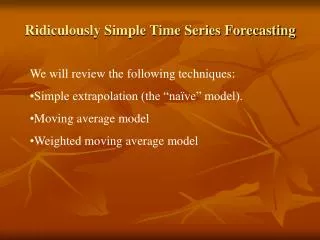
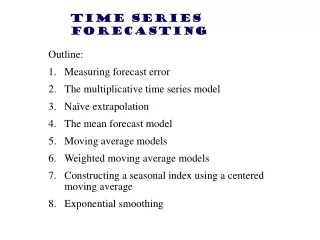
Problems Current work mainly utilises linear time-series models, such as MA (Moving Average), AR (Autoregressive), Box-Jenkins… Focusing on CPU load prediction for the execution time of computation intensive activities Data intensive activities? Many other overheads? Forecasting point values Duration intervals are more applicable in practice Requiring large sample size Difficult for scientific workflow activities with constrained concurrent instances and long-term durations Frequent turning points Significantly deteriorates the effectiveness of linear time-series models
Introduction Time-Series Forecasting Time-Series Patterns Forecasting Duration Intervals of Scientific Workflow Activities based on Time-Series Patterns Motivation Pattern Based Time-Series Forecasting Strategy Evaluation Conclusion Where Are We 9
Strategy Overview Duration series building A periodical sampling plan to increase the sample size Duration pattern recognition A non-linear time-series segmentation algorithm to identify potential pattern set checking validity final pattern set Duration pattern matching Similarity search for the closet pattern give the latest duration sequence Duration interval forecasting Duration interval forecasting based on the statistics of the matched duration pattern Pattern based time-series forecasting strategy
Step 1: Duration Series Building A periodical sampling plan where the samples with their submission time belonging to the same observation time unit of each period are joined together to address the problem of limited sample size. A representative duration series is built with the sample mean of each unit. Periodical sampling
Step 2: Pattern Recognition Discovering potential pattern set K-MaxSDev time-series segmentation algorithm K-MaxSDev: a hybrid time-series segmentation algorithm based on Bottom-Up, Sliding Windows and Top-Down K: the initial value for equal segmentation MaxSDev (Maximum Standard Deviation): the testing criterion for time-series segmentation K and MaxSDev can be specified with empirical functions provided in the paper (Formula 1 and Formula 2)
K-MaxSDev: Bottom-Up Process Initial K equal segmentation
K-MaxSDev: Sliding Window Process Sliding Window to merge neighbouring segments
K-MaxSDev: Sliding Window Process Testing the standard deviation of the new segment SDev with MaxSDev
K-MaxSDev: Sliding Window Process If SDev ≥ MaxSDev, testing failed, stay separated Failed
K-MaxSDev: Sliding Window Process If SDev < MaxSDev, testing successful, merge to form a larger segment Successful
K-MaxSDev: Top-Down Process After Sliding Window process, split those segments which cannot be merged with any neighbours
K-MaxSDev: Iteration Repeat Sliding Window and Top-Down until all segments cannot be merged with neighbouring segments.
Pattern Validation Validating the final segments with Min_pattern_length to ensure its statistic effectiveness. If failed, marked with ‘invalid’, otherwise, marked with ‘valid’.
Turning Points Discovery Turning points are specified as either the mean of the invalid pattern or the first value of the next valid pattern. K-MaxSDev ensures the violations of MaxSDev only occur on the edge of two adjacent segments where the deviations exceed the threshold of MaxSDev
Step 3: Pattern Matching The latest duration sequence with SDev and Mean, can be classified into three types Type 1: SDev>MaxSDev Cannot match any valid patterns and must contain at least one turning point First locate the turning points and then conduct pattern matching If SDev<MaxSDev, searching for the matched pattern based on Mean. The matched pattern with PSDev and PMean Type 2: SDev ≥PSDev Typ3 3: SDev < PSDev
Step 4: Interval Forecasting The user specified confidence value is α% with λ probability percentile, the predicted mean of the next value is M and its standard deviation is S. The interval of the next value is predicted to be (M- λS, M+ λS) For Type 2: PSDev ≤SDev<MaxSDev The next value of the sequence will probably be a turning point since it is on the edge of two different patterns. The value of the turning point is TP. M = TP, S = MaxSDev For Type 3: SDev<PSDev The next value of the sequence can be predicted with the statistical features of the matched pattern M = PMean, S= PSDev
Introduction Time-Series Forecasting Time-Series Patterns Forecasting Duration Intervals of Scientific Workflow Activities based on Time-Series Patterns Motivation Pattern Based Time-Series Forecasting Strategy Evaluation Conclusion Where Are We 25
Simulation Environment SwinDeW-G: a peer-to-peer based grid workflow system running on the SwinGrid (Swinburne service Grid) platform
Duration Series Building Sample: 15 duration-series, length 8 hour (8:00am~8:00pm), observation unit every 15 mins. Parameters: K=12, MaxSDev=2.24, Min_Pattern_Length=3
Forecasting Performance Testing on 30 duration sequences with random length of 3 to 5. Predicted Duration Intervals
Comparison of Prediction Errors MEAN: Use the mean value of the duration sequence as prediction LAST: Use the last value of the duration sequence as prediction
Introduction Time-Series Forecasting Time-Series Patterns Forecasting Duration Intervals of Scientific Workflow Activities based on Time-Series Patterns Motivation Pattern Based Time-Series Forecasting Strategy Evaluation Conclusion Where Are We 33
Conclusion Scientific workflow activity durations are much more complicated than that of conventional computation tasks Conventional linear time-series forecasting models suffers from limited sample size and frequent turning points Time-series pattern based forecasting strategy Duration series building Duration pattern recognition and turning point discovery Duration pattern matching Duration interval forecasting Our strategy is more scalable with sample size and robust with turning points
The End • Thanks! Any Questions?