Download
1 / 59
590 likes | 851 Views
'Trends, time series and forecasting. Paul Fryers East Midlands KIT. Overview. Introduction Understanding trends and time series – Seasonality – Transformations Methods for analysing time series – Regression – Moving averages – Autocorrelation Overview of forecasting

E N D
'Trends, time series and forecasting Paul Fryers East Midlands KIT
Overview • Introduction • Understanding trends and time series – Seasonality • – Transformations • Methods for analysing time series – Regression • – Moving averages • – Autocorrelation • Overview of forecasting • Forecasting methods – Extrapolation of regression • – Holt’s method • Uses for forecasting – Setting and monitoring targets • – Estimating current values • General methodological points
What is a time series? • A set of well defined measures collected through time: • Mortality • Diagnoses • Temperature • Rainfall • Share price • Sunspots • Ice cream sales • Air passengers • Road accidents
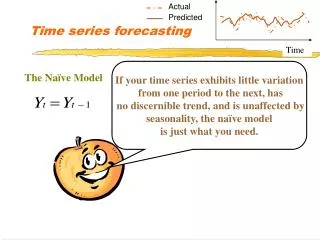
What is special about time series data? • There is an implicit order to the data with a first, second, third,..., nth value • Previous observations may be important determinants of later observations • this has implications for analysis • Trend and/or seasonal effects may be present • a trend is a tendency for observations to fall or rise over time • seasonal effects are regular repeating patterns of rises or falls • Different techniques are needed for analysis of historical data and for producing forecasts
Understanding trends and time series • First plot the data • Is the time series consistent? • Look for step changes in level or trend • Is there any visual evidence of any pattern or trend? • Is there evidence of a regular ‘seasonal’ pattern? • If there is a trend, is it linear? (probably not!)
Handling inconsistency • Usually, we will simply break the time series at the point where the trend changes, or the step change occurs • Analyse only the data since that point, or analyse the different parts of the time series separately • Or use a method/software that will do that automatically, eg by weighting more recent points more heavily • We may be able to adjust or transform the data prior to a step change but only if we understand the reason for the change and are confident that the adjustment makes the data consistent • eg adjusting for a coding change (ICD coding, definition of unemployment, etc.) • But it’s not always clear cut...
Handling outliers • Normally, we ignore outliers, ie exclude them from the analysis • this can be a nuisance for some analyses • But again, it’s not always clear cut: • we need to identify plausible reasons for the outlier/s (eg known issues with data collection, or a specific factor that has influenced the outcome)
Is there any visual evidence of any pattern or trend? Graph of an indicator showing a seasonal pattern plus rising trend
Handling seasonality • Seasonality can be additive or multiplicative • ie each different period in the cycle has an extra factor added to (or subtracted from) or multiplied by the overall average level • We can adjust the data by applying the inverse factor to each period • Easier to use an integrated method that adjusts for the seasonality within the analysis
Transformations – non-linear trends • In many cases, it is meaningless for the forecasts to fall below zero • In public health we are most commonly dealing with counts, rates or proportions • We routinely transform the data in order to ‘make the data linear’ and constrain them to be no less than zero • By default, we should use a log-transformation for counts or rates, fitting an exponential curve which assumes a constant rate of change, rather than a constant numerical increase or decrease • We should use a logit-transformation for proportions (or percentages), which constrains the variable to be between 0 and 1 (or 0% and 100%)
Transformations – falling exponential curve • A rapidly falling trend • The indicator looks to be heading rapidly towards zero, but the log transformation ensures that it stays positive: the rate or count is ‘tending towards’ zero but can never quite get there • It represents a constant rate of change (i.e. reducing by x% each year rather than reducing by a set amount each year) • This should be the default option for analysis of counts or rates
Transformations – rising exponential curve • A rapidly increasing trend • For a count or rate, mathematically it is preferable to use an exponential curve, but need to beware of other practical constraints: there will usually be some practical limit to a count or rate • If the continued rise in the count or rate is implausible then it is better to use a linear model or logit...
Transformations – log-transform counts and rates • Fitting an exponential curve: Equation of curve: ln(y) = ln(a) + ln(b)t or y = a × bt where y = value of variable being studied a = intercept on y-axis (nominal value of indicator at time 0) t = time value b = ‘gradient’ (amount y is multiplied by for each increase of 1 in time) • ln(0) = –∞ ln(∞) = ∞
Transformations – logistic curve • Proportions can not go below zero or above 1 • The tails are equivalent: e.g. proportion surviving = 1 – proportion dying • Particularly important for proportions that span a large range, from under 0.5 to nearly 1, e.g. percentage achievement on QOF scores • For proportions or percentages close to zero, the logit is equivalent to the log • For proportions always close to 1 could subtract from 1 and use log
Transformations – logit-transform proportions • The logit function: logit(y) = ln(y/(1–y)) = ln(y) – ln(1–y) • logit(0) = –∞ logit(½) = 0 logit(1) = ∞ • We transform proportions by applying the logit function, then fit a regression line to the transformed data • For rates or counts which have a practical limit, if we have a sound basis for estimating that realistic maximum then we could do so and treat the rate or count as a proportion of that upper limit
Methods for analysing time series • Regression • Most common method: simply fit a line or curve to the data, treating ‘time’ as any other explanatory variable • Gives equal weight to all points in the time series • Assumes points are independent, identically distributed, observations • Gradient has confidence intervals: if CIs don’t include zero, the gradient is signicant • Two other concepts that are used as the basis for analysing time series: • Moving average • Autocorrelation
Moving average • Familiar as a method of presenting data • For annual data, rather than presenting data for 2004, 2005, 2006, 2007 and 2008, we may present three-year figures: 2004-06, 2005-07 and 2006-08 • Smoothes out fluctuations in the data, making trends easier to see • Also called ‘rolling averages’ • Moving averages of different periods can be used to highlight different features of a time series (example follows) • BUT!!! • Moving averages must not be used as the basis for regression, time series analysis or forecasting as they are not independent observations (they share their data with their neighbours) • [Note: time series methods such as Holt’s Method and Box-Jenkins (ARIMA) models use moving averages within the analysis, but the data from which the model is derived should not be moving averages]
Autocorrelation • In time series, observations can often be predicted by combinations of previous observations • If the observations are correlated with their immediate predecessors, we can calculate the Pearson correlation coefficient between them • This is called autocorrelation of lag 1 • Observations can also be correlated with predecessors from further back in the time series – autocorrelation of lag k (where k is number of observations back in the series) • In time series, observations can be predicted by combinations of previous observations • Smoothes out fluctuations in the data, making trends easier to see
Forecasting • Why do we need to forecast? • Extrapolating • Forecasting methods • Examples • Holt’s Method • Interval forecasts • How far back and how far forward? • Using forecasts • to set and monitor progress against targets • to estimate current health outcomes/indicators
Why do we need to forecast? • To inform planning by estimating future needs • the health of the population tends to change slowly and react slowly to public health interventions so we need to look ahead • To anticipate future major events • e.g. outbreaks • To set and monitor progress against targets • where are we likely to be on current progress? • are we on track to meet targets? • To estimate current health outcomes • our most recent data tend to be a year or more out of date so if we want to know where we are now or even where we were last year we have to forecast
Forecasting from past trends • If we have time series for a health outcome, health service output indicator or risk factor, we can use this to forecast future values • eg: • mortality rates • teenage pregnancy rates • hospital activity rates • prevalence estimates • Assumes: • consistent definitions and measurement, past and future • either that nothing significant changes, or that changes/ improvements continue at the same rate
Extrapolating from regression lines • A common method is to fit a regression line (or curve) to the historic data and extrapolate it to the future • This is OK for a short time into the future as long as the historic data are stable, ie changing at a steady rate • But: The regression line is fitted across the whole of the historic data, and gives equal weight to all points: e.g. the value for last year is given the same weight as one from 20 years ago – it doesn’t give the best estimate of ‘current trends’ • We cannot give realistic confidence intervals for future values (‘prediction intervals’ or ‘forecast intervals’)
Forecasting methods • There is a range of methods which are intended for forecasting, eg moving average methods, autocorrelation methods, Box-Jenkins methods • These methods take into account fluctuations from year to year, trends (ie gradual changes over time) and seasonal variations • They tend to give greater weight to more recent values, hence ‘start from where we are’ • They give confidence intervals for forecasts, which tend to get wider as we move further into the future • The most useful methods for public health applications tend to be Holt’s Method (which includes a trend component) and Holt-Winters (which adds a seasonal component) • Note, as with regression analysis, the points in the time series must be independent of each other: rolling averages must never be used for forecasting
Teenage conceptions – England http://www.empho.org.uk/pages/viewResource.aspx?id=11285
Teenage conceptions – London GOR http://www.empho.org.uk/pages/viewResource.aspx?id=11285
Teenage conceptions – Newham http://www.empho.org.uk/pages/viewResource.aspx?id=11285
Teenage conceptions – Harrow http://www.empho.org.uk/pages/viewResource.aspx?id=11285
Alcohol-related admission rates – Bassetlaw PCT Data provided to Nottinghamshire and Bassetlaw PCTs for WCC trajectories
Fractured neck of femur admission rates – Nottinghamshire PCT Data provided to Nottinghamshire and Bassetlaw PCTs for WCC trajectories
Emergency admission rates for acute coronary syndrome – East Midlands – males Report to East Midlands Cardiac & Stroke Network
Emergency admission rates for acute coronary syndrome – East Midlands – females Report to East Midlands Cardiac & Stroke Network