Download
1 / 12
120 likes | 211 Views
Determining and Interpreting Associations between Variables. Cross-Tabs Chi-Square Correlation. Types of Relationships between Variables. Non-monotonic - there is no direction to the relationship. Monotonic - there is a general direction of the relationship. Increasing - +ve relation.

E N D
Determining and Interpreting Associations between Variables Cross-Tabs Chi-Square Correlation
Types of Relationships between Variables Non-monotonic - there is no direction to the relationship. Monotonic - there is a general direction of the relationship. Increasing - +ve relation. Decreasing - -ve relation. Linear - y=a+bx Curvilinear - exponential, log, s shape, etc.
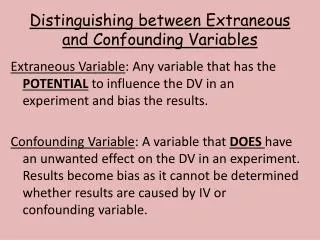
Characteristics of Relationships Presence - is it significance. Direction - monotonic or non-monotonic; -ve or +ve sign. Strength of association
Cross-Tabulations Cross-tabulations (cross-tabs) consist of rows and columns defined by the categories classifying each variable. • Frequencies Table • Raw Percentages Table • Column Percentages Table • Row Percentages Table
Cross-Tabs and Chi-Square • Cross-Tabs and Chi-square (x2) are used to assess whether or not a relationship exists between two nominally scaled variables. • Null hypotheses is that the two variables under investigation are NOT associated. • Chi-square statistics is calculated based on the difference between observed and expected frequencies
Chi-Square • Chi-square distribution is determined by its degrees of freedom • Degrees of freedom = (r-1)(c-1) • r = number of rows • c = number of columns Chi-sq = S(observed-expected)Sq/Expected
Correlation Coefficient • An index number constrained to fall between -1.0 and 1.0 that communicates both the strength and direction of association between two variables. • The greater the absolute size of the correlation coefficient, the greater the covariation between the two variables or the stronger is their association.
Is the correlation statistically significant? • If the correlation is not statistically significant, then it has very little meaning. • Null hypotheses states that the population correlation is zero; therefore, the null hypotheses needs to be rejected. • A correlation indicates the strength of association between variables by its size. The sign indicates the direction of the association.
Pearson Product Moment Correlation • The Pearson Product Moment Correlation ( r) measure the degree of linear association between two variables. • Not only indicates degree of association but direction as well. • Measures the “tightness” of measured points on a straight line (linear) • Interval scaling required
Pearson Product Moment Correlation • Only considers the two variables - all other factors are considered to not have any relationship on the two variables • Does not demonstrate cause and effect • Only expresses linear relationships (no curvilinear patterns)
Spearman Rank Order Correlation • Indicates strength and direction of a relationship between two rank (ordinal) variables. • Other forms of correlation that are specifically designed for ordinal and nominal data.