Download
1 / 34
350 likes | 456 Views
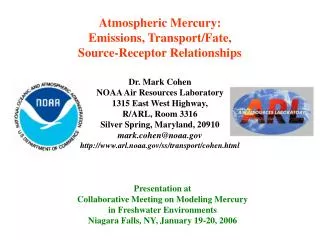
Mercury Transport, Fate and Health Impacts. Ellen Brown Office of Air and Radiation USEPA For Western Regional Air Partnership Board Meeting December 15, 2005. Lake. Ocean. methylation. methylation. Mercury Emissions Contribute to Exposure to Mercury. Atmospheric deposition. Fishing

E N D
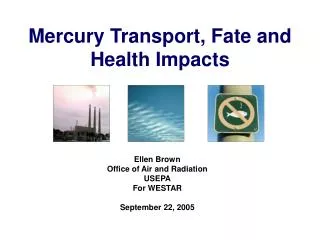
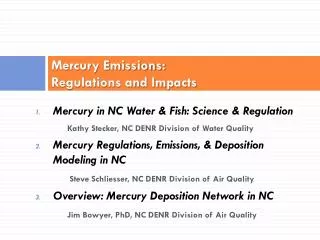
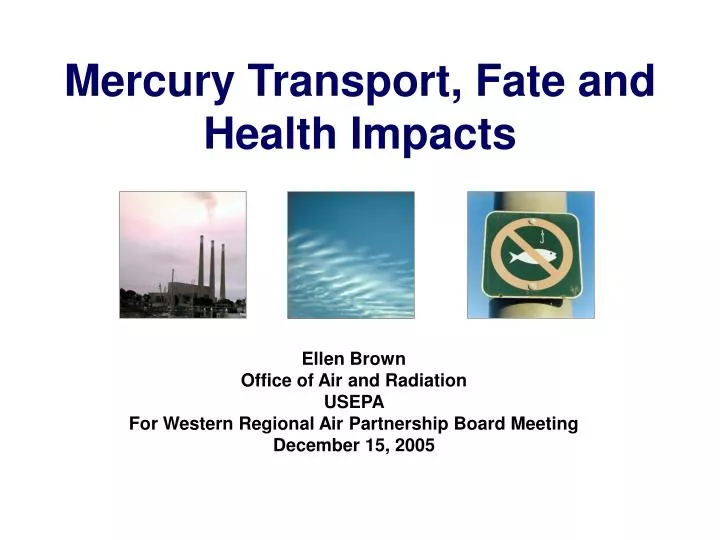
Mercury Transport, Fate and Health Impacts Ellen Brown Office of Air and Radiation USEPA For Western Regional Air Partnership Board Meeting December 15, 2005
Lake Ocean methylation methylation Mercury Emissions Contribute to Exposure to Mercury Atmospheric deposition • Fishing • commercial • recreational • subsistence • Impacts • Best documented impacts on the developing fetus: impaired motor and cognitive skills • Possible cardiovascular, immune, and reproductive system impacts Humans and wildlife affected primarily by eating contaminated fish Wet and Dry Deposition Emissions to the Air Mercury transforms into methylmercury in soils and water, then can bioaccumulate in fish Ecosystem Transport, Methylation, and Bioaccumulation Emissions and Speciation Atmospheric Transport and Deposition Human Exposure Consumption Patters • The primary pathway of human exposure to mercury in the U.S. is through eating contaminated fish. • Power plants emit approximately 48 tons of mercury and are the largest source of mercury emissions in the U.S. (approximately 41%).
Global Emissions of Mercury (metric tonnes/yr)
Anthropogenic Emissions of Mercury (metric tonnes/yr) 1990 Total: 1881 2000 Total: 2269 Based on Pacyna, J., Munthe J., Presentation at Workshop on Mercury: Brussels, March 29-30, 2004
U.S. Emissions of Mercury 209.57 184.76 117.76 Source: EPA 1990, 1996 NTI and EPA 1999 NEI. Short tons per year.
USEPA Regulation of Major Sources * CAMR will achieve an emissions level of 15 tons by about 2025
Atmospheric Transport/Transformation • The fate of mercury emissions depends on various factors, including the form (species) emitted, stack height, topography and meteorology. • Mercury is usually emitted in one or more of three different forms: • elemental mercury - believed to remain in the atmosphere up to one year. It can travel globally before undergoing transformation (although some deposits locally/regionally); • particle-bound mercury, which can deposit over a range of distances; and, • oxidized mercury (also called ionic or reactive gaseous mercury (RGM)), predominantly in water soluble forms, which may deposit from the atmosphere quickly and locally. • Therefore, depending on these emitted species and other factors, atmospheric mercury can be transported at varying distances, resulting in impacts on local, regional, continental and global scales.
Deposition • Mercury is deposited in precipitation and it is dry deposited • Current measurements of deposition are limited to wet deposition, owing to the lack of an acceptable dry deposition measurement method. • Dry deposition component considered to be significant – probably equaling wet deposition. • EPA’s most recent estimate, based on modeling, is that about 8 percent of mercury deposition in the US is from U.S. sources. - Revised estimate considers a number of factors including reductions in US emissions that have been realized since 1990 together with new and changing scientific information about atmospheric fate. • In general, where deposition is high, local and regional sources are usually significant contributors. Near major sources the contribution of that source can be well over 50% of total deposition.
Percent of Total Mercury Deposition Attributable to US & Canadian Sources: 2001
ALSO, Finer Modeling Resolution Better Highlights Local Impacts 36km Resolution Avg. = 98 ug/sq.m 12km Resolution Avg. = 110 ug/sq.m
Ecosystem Sensitivity for Mercury Methylation • Deposition is only one factor affecting the levels of mercury in fish. • Water bodies vary substantially in the extent to which deposited mercury is methylated. • Factors that can affect methylation include: Dissolved organic carbon PH Sulfate concentration Acid neutralizing capacity Wetlands or other hydric soils
Phytoplankton (algae) Small forage fish Predatory fish Zooplankton and Shellfish Less methylmercury More methylmercury Bioaccumulation • Methylmercury accumulates through aquatic food webs. • Highest levels are in large predatory fish and fish-eating (piscivorous) animals. • Measured methylmercury levels in large fish are 1 – 10 million fold higher than measured levels in water. • Extent of bioaccumulation is highly variable and hard to predict from one water body to another. It depends on many factors: - Including the length of food chain and what organisms live in the water.
USGS Mercury Methylation Sensitivity Map for Aquatic Ecosystems (Preliminary) Based on USGS data for TOC, pH, aquatic sulfate concentration, and hydric soils. Areas not colored are missing data for one or more of these indicators.
Terrestrial and Aquatic Fate: Freshwater • Some recent evidence of more rapid response than previously thought to reductions in mercury loadings: • METAALICUS: • Scientists added small amounts of isotopically labeled mercury to a lake ecosystem to trace its movement through the system. • Mercury deposited to the lake surface was found in perch within a few months. • After a year this mercury comprised 15% of the mercury found in 1 yr old perch. • Results seem to indicate that older mercury is less available for methylation. This suggests that the lake would respond quickly to reduction in loading. The study needs to be completed, confirmed, and replicated. • Evidence that mercury deposited to uplands responds more slowly. • Florida Everglades: • Large reductions in loadings in the early 1990s due to bans on mercury in batteries and paints. Further reductions in late 1990s and early 2000s due to regulations requiring emissions reductions from municipal waste combustors. • Levels in game fish have fallen 60-70 percent. • Note: Older, drier systems may respond more slowly. • Both projects funded by wide range of federal, state, and private organizations.
Terrestrial and Aquatic Fate: Saltwater Less is known about the fate of mercury in saltwater environments and extent or speed with which it responds to a change in deposition. Several researchers have assumed a proportional relationship between a change in deposition and a change in fish concentrations (EPRI 2003, Tresande, et al 2005, Rice and Hammitt 2005, Gayer and Hahn 2005). It is not known whether this is correct. Marine systems Large, fish-eating fish have been measured with very high levels of mercury (e.g. shark, swordfish). Key question is where the mercury in ocean fish comes from. Estuarine systems (and costal systems) High levels of mercury have been measured in some fish (e.g. King Mackerel) More data being developed on systems like Long Island Sound. Because salt water fish is a major source of nutrition for many people around the world, this is a critical area of research
Fish Consumption Advisories for Mercury 2004 Source: US EPA, 2004 National Listing of Fish Advisories
Fish Consumption • In a 30 day survey, the USDA Continuing Study of Food Intake by Individuals reports that 88% of Americans eat fish. • Americans eat commercial and self-caught fish. Most fish people eat in the US is commercial. • Commercial fish is domestic, farm raised and imported. About 57% of the fish Americans eat is either domestic (fresh water, estuarine and coastal) commercial, self caught or farm raised. • Efforts to reduce mercury emissions in the US can have the greatest impact on self-caught fish and domestic commercial fish. Farm raised fish are usually thought to not be high in mercury.
Fish Consumption • Fish consumption is highly variable. • Typical US consumers eating moderate amounts of a variety of fish from restaurants and grocery stores are not likely to be exposed above the RfD. But those who regularly and frequently consume fish are more likely to experience the higher exposure to mercury that may put them or their fetuses at risk for adverse impacts.
Fish Consumption cont’d Sensitive or Highly-Exposed Subpopulations -- Available consumption data do not allow for a clear and comprehensive understanding of subpopulation consumption patterns. • Women of childbearing age (women who may become pregnant) in the general population and in highly exposed subpopulations. • An unborn child can incur neurological damage from exposure in utero. • Recreational fishers and their families. • Can consume higher amounts of self-caught fish than the general population. • Native Americans. • Can consume higher amounts of locally-caught finfish and shellfish than the general population. • Asian and Pacific Islanders. • Can consume higher amounts of shellfish and finfish (commercial and/or locally-caught) than the general population. • Individuals who fish for the purpose of meeting their (and their family’s) nutritional needs (Subsistence Fishers). • Can consume greater amounts of local self-caught fish than the general population.
Health Effects of Methylmercury Exposure • Methylmercury is an established human neurotoxin • Major outbreaks in Minamata and Iraq 30 to 40 years ago established methylmercury as a human neurotoxin following high-dose exposures. • Additional case reports from multiple locations further confirmed effects. • Several large studies look at effects at dosages commonly seen in the US. • The National Research Council, National Academy of Sciences has reviewed the health science.
Health Effects cont’d • Most sensitive population are children exposed in utero • Decreased ability to perform well in school • Declines in visuospatial function • Delays in ability to recall and process information • Diminished intelligence. “ The population at highest risk is the children of women who consumed large amounts of fish and seafood during pregnancy. … the risk to that population is likely to be sufficient to result in an increase in the number of children who have to struggle to keep up in school and who might require remedial classes or special education.” -- NAS Report
Not Included in EPA’s Current Health Assessments of Adverse Effects • Cardiovascular Effects • Immune System and Reproductive Effects • Delayed Neurotoxicity
Adult Cardiovascular Effects:Association with Mercury Exposures Salonen et al. studied 1983 men living in Eastern Finland aged 42 to 60 years (Salonen et al., Circulation 91:645-655, 1955; Atherosclerosis 148:265-263, 2000). • Report that mercury is a risk factor for coronary and fatal cardiovascular disease. • Dietary intake of fish and mercury were associated with significantly increased risk of acute myocardial infarction and death from coronary heart disease, cardiovascular disease and any death. Guallar, et.al. studied men from Europe and Israel, age 70 or younger (Gaullar, et. al., New England Journal of Medicine, Vol. 374, No. 22, November 2002) • Mercury levels measured in toenails was directly associated with risk of myocardial infarction. • High mercury levels in fish may diminish the carioprotective effect of fish intake. Yoshizawak et. al. study of American male healthcare workers (Yoshizawak et. al. New England Journal of Medicine, Vol. 374, No. 22, November 2002) • Did not support a relationship between mercury levels and coronary heart disease. • Majority of sample were dentists exposed to inorganic mercury
EPA’s Reference Dose for Methylmercury • Designed as a level of exposure at which there is thought to be no “appreciable risk” • Developed by US EPA based on: - NRC/NAS Committee’s Recommendations - Independent data assessment by EPA scientists and consultants. - Recommendations of EPA peer review panels.
US EPA’s Reference Dose EPA’s RfD for methylmercury is based on: • NRC/NAS Committee’s Recommendations The Faroe Island study and the Boston Naming Test -Neuropsychological test that indicates neuropsychological processes involved with a child’s ability to learn and process information. • Independent data assessment by EPA scientists and consultants. Recommendations of EPA peer review panels. • The point of departure, a Benchmark Does Level (BMDL)- a level where we see a doubling of the prevalence of scores on tests of developmental function in a range recognized as clinically subnormal. • Both US EPA and NRC used a BMDL of approximately 58 ug/L of cord blood. Note: Dose conversion of cord blood [Hg] to maternal blood [Hg] was assumed to be 1:1. More recent assessments indicate cord blood is, on average, 1.7 times higher in mercury than maternal blood concentrations. 58 ug/L cord blood [Hg] ~ 34 ug/L maternal blood [Hg]
US Exposures • CDC (NHANES) reports that 5.7 percent of the women of child-bearing age in the US are exposed at levels greater than the RfD from 1999-2002 • CDC began collecting data pertaining to mercury in 1999. In the period 1999 to 2000, 8 percent of these women had exposures above the reference dose. It is too early to call this a trend. • Good correlation of mercury blood levels and fish consumption.
Concluding Comments • We can expect to affect exposures by limiting emissions of mercury to the air. • Exactly how much exposure will be reduced in a given place as a result of a specific policy is difficult to say with certainty given current tools. - We can make estimates. But they are not certain. • Mercury is not about the average – deposition, fish concentration, fish consumption. It is about the tail of the distribution.
Mean Methylmercury Concentrations for "Top 24" Types of Fish Consumed in U.S. Commercial Seafood Market Source: Carrington and Bolger, 2002
Percent Contribution to per capita Methylmercury Intake by Fish Type for "Top 24" Types of Fish in U.S. Commercial Seafood Market
Distribution of Blood Organic Mercury (µg/L)Adult Women – NHANES 1999 thru 2002 Presented by Dr. Kathryn Mahaffey at the Fish Forum, Baltimore, MD Sept 19, 2005