Download
1 / 50
500 likes | 641 Views
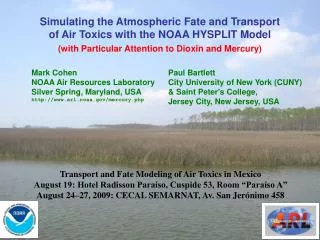
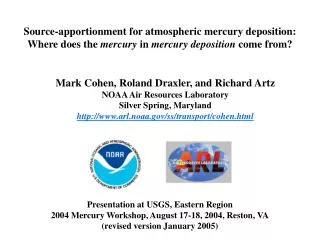
Atmospheric Mercury: Emissions, Transport/Fate, Source-Receptor Relationships. Dr. Mark Cohen NOAA Air Resources Laboratory 1315 East West Highway, R/ARL, Room 3316 Silver Spring, Maryland, 20910 mark.cohen@noaa.gov http://www.arl.noaa.gov/ss/transport/cohen.html. Presentation at

E N D
Atmospheric Mercury:Emissions, Transport/Fate, Source-Receptor Relationships Dr. Mark Cohen NOAA Air Resources Laboratory 1315 East West Highway, R/ARL, Room 3316 Silver Spring, Maryland, 20910 mark.cohen@noaa.gov http://www.arl.noaa.gov/ss/transport/cohen.html Presentation at Collaborative Meeting on Modeling Mercury in Freshwater Environments Niagara Falls, NY, January 19-20, 2006
Mercury in the Environment • 3 emission source types: • anthropogenic; • natural; • re-emitted • 3 forms of emissions: • reactive: Hg(II); • particulate: Hg(p); • elemental: Hg(0). • Hg(0) has a long atmospheric lifetime; can be transported globally; >90% in air is Hg(0) • Hg(II) and Hg(p) have shorter atmospheric lifetimes and deposit more locally and regionally. • Deposition within the US and Canada comes from domestic sources and the global pool Source: adapted from slides prepared by USEPA and NOAA 2
Atmospheric Mercury Model Meteorology Transport and Dispersion Atmospheric Chemistry Wet and Dry Deposition Emissions Model results Source attribution Model evaluation Measurements at specific locations Ambient concentrations and deposition
Global natural and anthropogenic emissions of mercury. Estimates taken/ inferred from Lamborg et al. (2002). All values are in metric tons per year, and are for ~1990. Lamborg C.H., Fitzgerald W.F., O’Donnell L., Torgersen, T. (2002). Geochimica et Cosmochimica Acta66(7): 1105-1118.
Source of global data: Global Anthropogenic Mercury Emission Inventories for 2000 and 1995: Pacyna, J. and E. Pacyna. Journal of Air and Waste Management Association (in prep. 2005); http://www.amap.no/Resources/HgEmissions/HgInventoryDocs.html 6
Different patterns of anthropogenic mercury emissions Source: U.S. EPA Source: Streets et al., 2005, “Anthropogenic mercury emissions in China”, Atmospheric Environment 39, 7789-7806 Source: Environment Canada 7
Some Current Emissions Inventory Challenges • Re-emissions of previously deposited anthropogenic Hg • Emissions speciation [at least among Hg(0), Hg(II), Hg(p); more specific species if possible] • Reporting and harmonization of source categories • Mobile source emissions? • Enough temporal resolution to know when emissions for individual point sources change significantly Note: Hg continuous emissions monitors now commercially available 8
U.S. Anthropogenic Emissions for 1990 and 1999 (USEPA) There were big reported changes in emissions between 1990 and 1999, but when did these occur? And when did they occur for individual facilities? 9
Atmospheric Mercury Model Meteorology Transport and Dispersion Atmospheric Chemistry Wet and Dry Deposition Emissions Model results Source attribution Model evaluation Measurements at specific locations Ambient concentrations and deposition
Atmospheric Mercury Elemental Mercury [Hg(0)] cloud Hg(II), Reactive Gaseous Mercury [RGM] Particulate Mercury [Hg(p)] CLOUD DROPLET Hg(II) reducedto Hg(0) by SO2 and sunlight Vapor phase Hg(0) oxidized to RGM and Hg(p) by O3, H202, Cl2, OH, HCl Adsorption/ desorption of Hg(II) to /from soot Hg(p) Hg(p) Dissolution? Primary Anthropogenic Emissions Hg(0) oxidized to dissolved Hg(II) species by O3, OH, HOCl, OCl- Re-emission of previously deposited mercury Natural emissions Wet and Dry Deposition 12
Why are emissions speciation data - and potential plume transformations -- critical? Logarithmic NOTE: distance results averaged over all directions – Some directions will have higher fluxes, some will have lower 14
Some Current Atmospheric Chemistry Challenges • Plume chemistry, e.g., rapid reduction of RGM to elemental mercury? • If significant reduction of RGM to Hg(0) is occurring in power-plant plumes, then much less local/regional deposition 15
RGM reduction in power-plant plumes? • If significant reduction of RGM to Hg(0) is occurring in power-plant plumes, then much less local/regional deposition • No known chemical reaction is capable of causing significant reduction of RGM in plumes – e.g. measured rates of SO2 reduction can’t explain some of the claimed reduction rates • Very hard to measure • Aircraft • Static Plume Dilution Chambers (SPDC) • Ground-based measurements 16
RGM reduction in power-plant plumes? • Most current state-of-the-science models do not include processes that lead to significant reduction in plumes • Recent measurement results show less reduction • Significant uncertainties – e.g., mass balance errors comparable to measured effects… • Current status – inconclusive… but weight of evidence suggest that while some reduction may be occurring, it may be only a relatively small amount • Recent measurements at Steubenville, OH appear to show strong local mercury deposition from coal-fired power plant emissions. 20
Some Current Atmospheric Chemistry Challenges • Plume chemistry, e.g., rapid reduction of RGM to elemental mercury? • Boundary conditions for regional models? 21
Some Current Atmospheric Chemistry Challenges • Plume chemistry, e.g., rapid reduction of RGM to elemental mercury? • Boundary conditions for regional models? • Oxidation of elemental mercury by O3 and OH• may be over-represented, leading to overestimation of the contribution of global sources to regional deposition Calvert, J., and S. Lindberg (2005). Mechanisms of mercury removal by O3 and OH in the atmosphere. Atmospheric Environment 39: 3355-3367. 24
Some Current Atmospheric Chemistry Challenges • Plume chemistry, e.g., rapid reduction of RGM to elemental mercury? • Boundary conditions for regional models? • Oxidation of elemental mercury by O3 and OH• may be over-represented, leading to overestimation of the contribution of global sources to regional deposition Calvert, J., and S. Lindberg (2005). Mechanisms of mercury removal by O3 and OH in the atmosphere. Atmospheric Environment 39: 3355-3367. • Atmospheric methyl-mercury: significance? sources? transport? chemistry? deposition? e.g., Hall et al. (2005). Methyl and total mercury in precipitation in the Great Lakes region. Atmospheric Environment 39: 7557-7569. 25
Some Current Atmospheric Chemistry Challenges • Plume chemistry, e.g., rapid reduction of RGM to elemental mercury? • Boundary conditions for regional models? • Oxidation of elemental mercury by O3 and OH• may be over-represented, leading to overestimation of the contribution of global sources to regional deposition Calvert, J., and S. Lindberg (2005). Mechanisms of mercury removal by O3 and OH in the atmosphere. Atmospheric Environment 39: 3355-3367. • Atmospheric methyl-mercury: significance? sources? transport? chemistry? deposition? e.g., Hall et al. (2005). Methyl and total mercury in precipitation in the Great Lakes region. Atmospheric Environment 39: 7557-7569. • Source-Receptor answers influenced by above factors 26
Atmospheric Mercury Model Meteorology Transport and Dispersion Atmospheric Chemistry Wet and Dry Deposition Emissions Model results Source attribution Model evaluation Measurements at specific locations Ambient concentrations and deposition
Some Model Evaluation Issues • Data availability • Simple vs. Complex Measurements
A major impediment to evaluating and improving atmospheric Hg models has been the lack of speciated Hg air concentration data There have been very few measurements to date, and these data are rarely made available in a practical way (timely, complete, etc.) Situation may be getting better, largely because of meetings like this! Data availability
models need ambient air concentrations first, and then if they can get those right, they can try to do wet deposition... ambient air monitor wet dep monitor Simple vs. Complex Measurements: 1. Wet deposition is a very complicated phenomena... ? • many ways to get the “wrong” answer – incorrect emissions, incorrect transport, incorrect chemistry, incorrect 3-D precipitation, incorrect wet-deposition algorithms, etc.. ? ?
atmospheric phenomena are complex and not well understood; • models need “simple” measurements for diagnostic evaluations; • ground-level data for rapidly depositing substances (e.g., RGM) hard to interpret • elevated platforms might be more useful (at present level of understanding) monitor above the canopy ? monitor at ground level Simple vs. Complex Measurements: 2. Potential complication with ground-level monitors... (“fumigation”, “filtration”, etc.)...
Simple vs. Complex measurements - 3. Urban areas: • Emissions inventory poorly known • Meteorology very complex (flow around buildings) • So, measurements in urban areas not particularly useful for current large-scale model evaluations
Simple vs. Complex Measurements – 4: extreme near-field measurements Sampling site? Ok, if one wants to develop hypotheses regardingwhether or not this is actually a sourceof the pollutant (and you can’t do a stack test for some reason!). • Sampling near intense sources? • Must get the fine-scale met “perfect”
Complex vs. Simple Measurements – 5: Need some source impacted measurements • Major questions regarding plume chemistry and near-field impacts (are there “hot spots”?) • Most monitoring sites are designed to be “regional background” sites (e.g., most Mercury Deposition Network sites). • We need some source-impacted sites as well to help resolve near-field questions • But not too close – maybe 20-30 km is ideal (?)
Some Current Model Evaluation Challenges • Lack of speciated atmospheric concentration measurements, at ground level and aloft • Emissions inventory uncertainties, including speciation and temporal resolution – i.e., is the model wrong or is the inventory wrong? • It has not really been possible to adequately evaluate current atmospheric mercury models 35
Atmospheric Mercury Model Meteorology Transport and Dispersion Atmospheric Chemistry Wet and Dry Deposition SUMMARY Emissions Model results Source attribution Measurements at specific locations Model evaluation Ambient concentrations and deposition
Thanks! 37
EXTRA SLIDES 38
Sources of Data:U.S. [USEPA], Canada [Environment Canada], China [Streets et al., 2005, “Anthropogenic mercury emissions in China”, Atmospheric Environment 39, 7789-7806] 39
wet dep monitor Challenges of using wet deposition data to assess local and regional deposition impacts… • Wind has to blow from source to monitoring site • It has to be raining at the monitoring site when this happens • It can’t have rained so much along the way that the mercury has all been deposited already • Weekly integrated samples (e.g, MDN) complicate interpretation -- as several different rain events (with different source-attributions) can contribute to one sample • MDN monitoring generally sited not to be impacted by local/regional sources • Can have high deposition because there is a lot of rain, or because there is a lot of mercury… 40
monitor at ground level Challenges of using air concentration data to assess local and regional deposition impacts… • Need speciated data (Hg0, Hg(p), RGM) • Relatively expensive and time-consuming • Still have problem of having the plume hit the site, but can measure continuously… and the plume hit and rain doesn’t have to occur at the same time (as with wet dep monitors) … • Results from ground-level monitors can be hard to interpret – • rapid dry deposition … large vertical gradients … measuring right where things are changing very rapidly … don’t want the whole analysis to depend on whether the sampler was at an elevation of 10 meters or 2 meters… • fumigation… filtration by plant canopies ? 41
monitor above the canopy monitor at ground level Observations of “depleted” RGM at ground-based stations downwind of power plants – sometimes thought to be evidence of RGM reduction to Hg0 -- might be strongly influenced by RGM dry deposition…would be better to have a monitor far above the canopy… ? 42
Preliminary Results from Steubenville Hg Deposition Source Apportionment Study Briefing for Tim Oppelt April 27, 2005 Presented by Tim Watkins, NERL Research conducted by Matt Landis, Gary Norris, and David Olson in collaboration with the University of Michigan
Results • Approximately 70% of Hg wet deposition at Steubenville site is attributable to local/regional fossil fuel (coal and oil) combustion sources • Not entirely attributable to electric utilities • Preliminary results • Additional analysis to finalize results will be completed within a month Steubenville
Questions about 1990 Baseline Inventory • There were few stack tests for waste incineration (and other sources), and thus, 1990 inventory must have been based primarily on emissions factors. • How confident can we be about 1990 emissions estimates? • Example: Phoenix Services medical waste incinerator in Baltimore MD: • Estimated to be the largest source of RGM in the U.S., in 1999 EPA emissions inventory. • This inventory estimate was apparently made using standard emissions factors for medical waste incineration. • However, stack tests appear to indicate that the inventory estimates were on the order of a factor of 10 too high! 45
Questions about 1996 Inventory • From the U.S. EPA website (re-checked Dec 12, 2005): • “October 1, 2003: • The 1996 National Toxics Inventory and the 1996 Emission Inventory for criteria pollutants data and documentation are no longer available. • The EPA has released the 1999 National Emissions Inventory for Criteria and Hazardous Air Pollutants. It is the most recent inventory available. • We recommend the use of the 1999 NEI because better quality data were submitted to EPA and new methodologies have been used.” • http://www.epa.gov/ttn/chief/net/1996inventory.html 46
Questions about 1999 Inventory • The 1999 emissions inventory for municipal waste incinerators is believed to have assumed a level of compliance with regulations that did not actually exist in 1999 for all facilities. USEPA (2005). Emissions Inventory And Emissions Processing For The Clean Air Mercury Rule (CAMR). Office Of Air Quality Planning And Standards, Research Triangle Park, NC http://www.epa.gov/ttn/atw/utility/emiss_inv_oar-2002-0056-6129.pdf • The assumed 1999 emissions may not have actually been realized at some facilities until sometime in 2000 or 2001 47
Sensitivity Analysis of Modeled Mercury Deposition O. Travnikov, I. Ilyin (2005). Regional Model MSCE-HM of Heavy Metal Transboundary Air Pollution in Europe. EMEP/MSC-E Technical Report 6/2005. Meteorological Synthesizing Centre – East, Moscow, Russia. http://www.msceast.org/events/review/hm_description.html 50