Download
1 / 14
140 likes | 353 Views
An Overview of GIS-based Corridor Analysis. by Joseph K. Berry W. M. Keck Scholar, University of Denver – August, 2003 jkberry@du.edu www.innovativegis.com/basis/ .

E N D
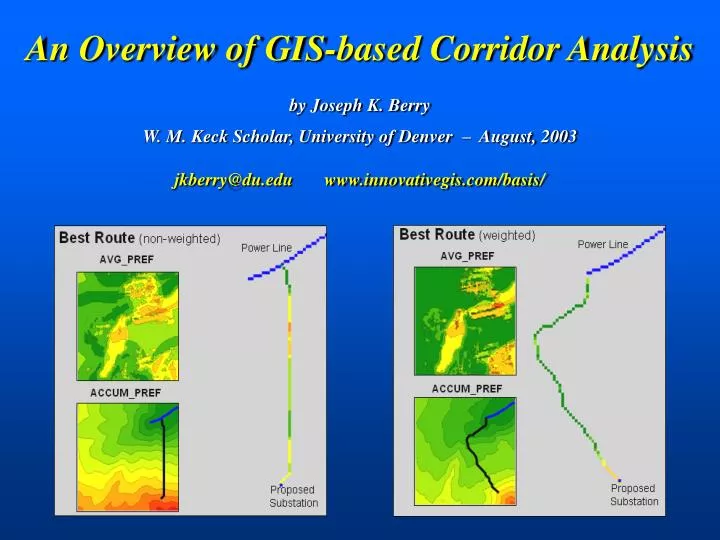
An Overview of GIS-based Corridor Analysis by Joseph K. Berry W. M. Keck Scholar, University of Denver – August, 2003 jkberry@du.edu www.innovativegis.com/basis/
GIS-based approaches for siting electric transmission lines utilize relative rankings and weights in considering factors affecting potential routes… Background The weights for numerous factors, such as slope, proximity to existing roads, visual exposure and population density, are established for each grid cell location then analyzed for the overall “most preferred path” in a project area. In practice, the criteria rankings and sub-model weights are altered to identify a set of alternatives to evaluated for the best route. A quantitative process for establishing objective and consistent rankings and weights is critical in developing a robust transmission line routing methodology… This workshop is designed to establish baseline criteria ratings and sub-model weights based on different group perspectives of the relative importance of the various routing considerations.
Macro Corridor Generation Based on statewide data to identify an encompassing area for collecting and assembling high resolution data (e.g., aerial photography, building/house location, existing utilities, census data, etc.) required for a specific proposed transmission line Macro Corridor Route Corridor SelectionRelative preference for different routing criteria are used to identify alternative routes for transmission line routing— Base Maps(high resolution data within macro corridor) Derived Maps(derived decision criteria as needed) Interpreted Maps(apply criteria ratings reflecting relative preferences) Discrete Preference Map(weighted average of criteria preferences) Accumulated Preference Surface(from start to everywhere) Most Preferred Route(from start to end point of new line) Alternate Route Generation(weighted average of preferences) Route Comparison and Summary(map display, geo-query and statistics) Preference Maps Most Preferred Route Study Area Statewide database of major factors in siting a transmission line GIS-based Corridor Analysis Overview Route DesignEngineering considerations are applied to define the centerline within the best route corridor
Existing Powerline Goal – identify the best route for an electric transmission line that considers various criteria for minimizing adverse impacts. Proposed Substation Houses • Criteria– the transmission line should… • Avoid areas of high housing density • Avoid areas that are far from roads • Avoid areas within or near sensitive areas • Avoid areas of high visual exposure to houses Roads Sensitive Areas Elevation Houses Transmission Line Siting Model (Hypothetical Example)
Avoid areas of… High Housing Density Far from Roads In or Near Sensitive Areas High Visual Exposure Model logic is captured in a flowchart where the boxes represent maps and lines identify processing steps leading to a spatial solution Siting Model Flowchart (Model Logic)
Step 1 Identify overall Discrete Preference (1-9 rating) Step 2 Generate an Accumulated Preference surface from the starting location to everywhere Step 3 Step 2 Step 1 Step 3 Identify the Most Preferred Route from the end location Model logic is captured in a flowchart where the boxes represent maps and lines identify processing steps leading to a spatial solution Most Preferred Route (Model Implementation)
Model calibration refers to establishing a consistent scale from 1 (most preferred) to 9 (least preferred) for rating each map layer 1 for 0 to 5 houses …group consensus is that low housing density is most preferred Calibrating Map Layers (Relative Preferences) The Delphi Process is used to achieve consensus among group participants. It is a structured method involving iterative use of anonymous questionnaires and controlled feedback with statistical aggregation of group response.
Model weighting establishes the relative importance among map layers (model criteria) on a multiplicative scale …group consensus is that housing density is very important (10.38 times more important than sensitive areas) (SA VS.HD)— avoiding locations of high Housing Density is very strongly to extremely more important (rating= 8) than avoiding locations close to Sensitive Areas. The Analytical Hierarchy Process (AHP) is used to establish relative importance among siting criteria based on group values. The procedure involves mathematically summarizing paired comparisons of the map layers’ importance. Weighting Map Layers (Relative Importance) HD * 10.38 R * 3.23 SA * 1.00 VE * 10.64
Discrete Preference map draped on Elevation Step 1 Discrete Preference Map … identifies the relative preference of locating a transmission line at any location throughout a project area considering multiple criteria Least Most Preferred
Step 2 Accumulated Preference Map … identifies the preference to construct the preferred transmission line from a starting location to everywhere in a project area Splash Algorithm – like tossing a stick into a pond with waves emanating out and accumulating costs as the wave front moves
Preferred Route Step 3 Most Preferred Route … the steepest downhill path over the accumulated preference surface identifies the most preferred route — minimizes areas to avoid
All factors are considered equally important sensitiveAreas and visualExposure ten times more important ANALYZE Pref_housingDensity TIMES 1 WITH Pref_roadProximity TIMES 1 WITH Pref_sensitiveAreas TIMES 1 WITH Pref_visualExposure TIMES 1 Mean FOR Pref_simpleAverage ANALYZE Pref_housingDensity TIMES 1 WITH Pref_roadProximity TIMES 1 WITH Pref_sensitiveAreas TIMES 10 WITH Pref_visualExposure TIMES 10 Mean FOR Pref_weightedAverage Generating Alternate Routes Simple Average, Environmental Factors; Built/Community Environment; Engineering factors
Route DesignEngineering considerations are applied to define the centerline within the best route corridor Assessing Alternative Routes (Best Route Corridor)
Welcome / Overview GIS-based Corridor Analysis OverviewStudy Area, Macro Corridor Generation, Alternative Route Generation, Route Selection, Design (Centerline) • Geographic Information Overview Database Considerations, Base Maps, Derived Maps • Methodology Approaches for determining routing criteria Calibration and Weights • Breakout SessionsGroup interaction and discussion using Delphi and Analytic Hierarchy Process (AHP) procedures to set— • Criteria Rating Calibration (1= attract to 9= repel) • Sub-Model Weight (Relative Importance weights sum to 1.0) • Wrap-upSummary and discussion of results, Critique and comments on Routing Model approach Group Meeting Agenda