Download
1 / 22
220 likes | 332 Views
Chapter 1 Data and Statistics. I need help!. Applications in Business and Economics. Data. Data Sources. Descriptive Statistics. Statistical Inference. Computers and Statistical Analysis. Data and Data Sets.

E N D
Chapter 1 Data and Statistics I need help! Applications in Business and Economics Data Data Sources Descriptive Statistics Statistical Inference Computers and Statistical Analysis
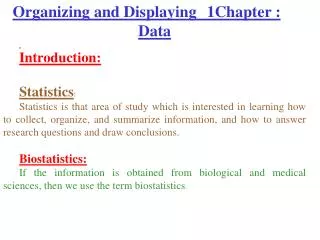
Data and Data Sets • Data are the facts and figures collected, summarized, analyzed, and interpreted. • The data collected in a particular study are referred to as the data set.
Elements, Variables, and Observations • The elements are the entities on which data are collected. • A variable is a characteristic of the elements. • The set of measurements collected for a particular element is called an observation.
Data, Data Sets, Elements, Variables, and Observations Variables Observation Element Names Stock Annual Earn/ Exchange Sales($M) Share($) Company AMEX 73.10 0.86 OTC 74.00 1.67 NYSE 365.70 0.86 NYSE 111.40 0.33 AMEX 17.60 0.13 Dataram EnergySouth Keystone LandCare Psychemedics Data Set
Scales of Measurement Scales of measurement include: Nominal Interval Ordinal Ratio The scale determines the amount of information contained in the data. The scale indicates the data summarization and statistical analyses that are most appropriate.
Scales of Measurement • Nominal = name categories, count frequencies Data are labels or names used to identify an attribute of the element. A nonnumeric label or numeric code may be used.
Scales of Measurement • Nominal Example: Students of a university are classified by the school in which they are enrolled using a nonnumeric label such as Business, Humanities, Education, and so on.
Scales of Measurement • Ordinal = rank categories in order, but no meaningful distance The data have the properties of nominal data And order or rank of the data is meaningful. A nonnumeric label or numeric code may be used.
Scales of Measurement • Ordinal Example: Students of a university are classified by their class standing using a nonnumeric label such as Freshman, Sophomore, Junior, or Senior.
Scales of Measurement • Interval = equal distance between scores; numerical The data have the properties of ordinal data, and the interval between observations is a fixed unit of measure. Interval data are always numeric.
Scales of Measurement • Interval Example: Melissa has an SAT score of 1205, while Kevin has an SAT score of 1090. Melissa scored 115 points more than Kevin.
Scales of Measurement • Ratio = equal distance, meaningful zero The data have all the properties of interval data and the ratio of two values is meaningful. Distance, height, weight, and time use the ratio scale. This scale must contain a zero value for which nothing exists for the variable
Scales of Measurement • Ratio Example: Melissa’s college record shows 36 credit hours earned, while Kevin’s record shows 72 credit hours earned. Kevin has twice as many credit hours earned as Melissa.
Qualitative Data Labels or names used to identify an attribute of each element Often referred to as categorical data Use either the nominal or ordinal scale of measurement Can be either numeric or nonnumeric Appropriate statistical analyses are rather limited
Quantitative Data Quantitative data indicate how many or how much: discrete, if measuring how many continuous, if measuring how much Quantitative data are always numeric. Ordinary arithmetic operations are meaningful for quantitative data.
Scales of Measurement Data Qualitative Quantitative Numerical Numerical Nonnumerical Nominal Ordinal Nominal Ordinal Interval Ratio
Descriptive Statistics • Descriptive statistics are the tabular, graphical, and numerical methods used to summarize data.
Example: Hudson Auto Repair The manager of Hudson Auto would like to have a better understanding of the cost of parts used in the engine tune-ups performed in the shop. She examines 50 customer invoices for tune-ups. The costs of parts, rounded to the nearest dollar, are listed on the next slide.
Example: Hudson Auto Repair • Sample of Parts Cost for 50 Tune-ups
Tabular Summary: Frequency and Percent Frequency Parts Cost ($) Percent Frequency Parts Frequency 2 13 16 7 7 5 50 4 26 32 14 14 10 100 50-59 60-69 70-79 80-89 90-99 100-109 (2/50)100
18 16 14 12 10 8 6 4 2 Graphical Summary: Histogram Tune-up Parts Cost Frequency Parts Cost ($) 50-59 60-69 70-79 80-89 90-99 100-110
Inferential Statistics • Uses samples from larger populations • Draw conclusions from sample data • Conclusions apply to whole population • Estimate a population value • Test a hypothesis • State probability of error