Download

1 / 21
210 likes | 671 Views
Definitions. Stroke volume:Each time the heart beats, a volume of blood is ejected. This stroke volume (SV), times the number of beats per minute (heart rate, HR), equals the cardiac output (CO).

E N D
1. CARDIAC OUTPUT
2. Definitions Stroke volume:
Each time the heart beats, a volume of blood is ejected. This stroke volume (SV), times the number of beats per minute (heart rate, HR), equals the cardiac output (CO).
��������������������������������������� CO = SV � HR
Stroke volume is expressed in ml/beat and heart rate in beats/minute. Therefore, cardiac output is in ml/minute. Cardiac output may also be expressed in liters/minute.
3. Factors determining CO Preload
Afterload
4. Definition of Frank-Starling Law Ability of the heart to change its force of contraction and therefore stroke volume in response to changes in venous return is called the Frank-Starling mechanism .
6. Cardiac function curves If in a controlled experimental model right atrial pressure is varied (independent variable) and the cardiac output measured (dependent variable), one will find that as PRA is increased, the cardiac output (CO) increases. When the mean PRA is about 0 mmHg (note that PRA normally fluctuates with atrial contraction and respiration), the cardiac output in an adult human is about 5 L/min. Because of the steepness of the cardiac function curve, very small changes in PRA (just a few mmHg) can lead to large changes in CO.
7. Afterload Afterload can be thought of as the "load" that the heart must eject blood against. In simple terms, the afterload is closely related to the aortic pressure. More precisely, afterload is related to ventricular wall stress (s ), where
s � (P � r) / h (P, ventricular pressure; r, ventricular radius; h, wall thickness).
8. Afterload When arterial pressure is reduced, the ventricle can eject blood more rapidly, which increases the stroke volume and thereby decreases the end-systolic volume. Because less blood remains in the ventricle after systole, the ventricle will not fill to the same end-diastolic volume found before the afterload reduction. Therefore, in a sense, the end-diastolic volume (preload) is "pulled along" and reduced as end-systolic volume decreases. Stroke volume increases overall because the reduction in end-diastolic volume is less than the reduction in end-systolic volume.
9. Afterload
10. Effect of an increase in afterload on SV When afterload increases, there is an increase in end-systolic volume and a decrease in stroke volume. An increase in afterload shifts the Frank-Starling curve down and to the right (from A to B). Explanation:, an increase in afterload decreases the velocity of fiber shortening. Because the period of time available for ejection is finite (~200 msec), a decrease in fiber shortening velocity reduces the rate of volume ejection so that more blood is left within the ventricle at the end of systole (increase end-systolic volume)
.A decrease in afterload shifts the Frank-Starling curve up and to the left (A to C)
Afterload per se does not alter preload; however, preload changes secondarily to changes in afterload.
11. Starling Law, Increased venous return increases the ventricular filling (end-diastolic volume) and therefore preload, which is the initial stretching of the cardiac myocytes prior to contraction. Myocyte stretching increases the sarcomere length, which causes an increase in force generation. This mechanism enables the heart to eject the additional venous return, thereby increasing stroke volume.
One mechanism to explain how preload influences contractile force is that increasing the sarcomere length increases troponin C calcium sensitivity, which increases the rate of cross-bridge attachment and detachment, and the amount of tension developed by the muscle fiber.
12. Frank Starling curves Frank-Starling curves show how changes in ventricular preload lead to changes in stroke volume.
When venous return is increased, there is increased filling of the ventricle along its passive pressure curve leading to an increase in end-diastolic volume.
13. Factors determining CO: Preload Preload can be defined as the initial stretching of the cardiac myocytes prior to contraction.� Preload, therefore, is related to the sarcomere length. Because sarcomere length cannot be determined in the intact heart, other indices of preload are used such as ventricular end-diastolic volume or pressure. For example, when venous return is increased, the end-diastolic pressure and volume of the ventricle are increased, which stretches the sarcomeres (increases their preload). As another example, hypovolemia resulting from a loss of blood due to hemorrhage leads to less ventricular filling and therefore shorter sacromere lengths (reduced preload). Changes in ventricular preload dramatically affect ventricular stroke volume by what is called the Frank-Starling mechanism. Increased preload increases stroke volume, whereas decreased preload decreases stroke volume by altering the force of contraction of the cardiac muscle.
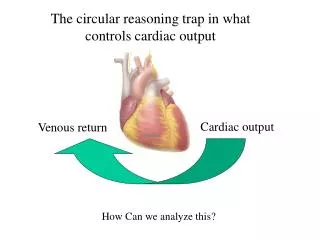
14. Venous Return (Preload) Venous return (VR) is the flow of blood back to the heart. Under steady-state conditions, venous return must equal cardiac output (CO) when averaged over time because the cardiovascular system is essentially a closed loop. Otherwise, blood would accumulate in either the systemic or pulmonary circulations. Although cardiac output and venous return are interdependent, each can be independently regulated.
15. Venous return (Preload) The concept of preload can be applied to either the ventricles or atria. Regardless of the chamber, the preload is related to the chamber volume just prior to contraction.
16. VR Venous return (VR) to the heart from the venous vascular beds is determined by a pressure gradient (venous pressure), PV, minus right atrial pressure, (PRA)and venous resistance (RV)
17. Factors affecting VR (Preload)
Muscle contraction. Rhythmical contraction of limb muscles as during normal locomotion (walking, running, swimming) promotes venous return by the muscle pump mechanism.
Decreased venous compliance. Sympathetic activation of veins decreases venous compliance, increases central venous pressure and promotes venous return indirectly by augmenting cardiac output through the Frank-Starling mechanism, which increases the total blood flow through the circulatory system.
Respiratory activity. During inspiration, the venous return increases because of a decrease in right atrial pressure.�
Vena cava compression. An increase in the resistance of the vena cava, as occurs when the thoracic vena cava becomes compressed during a Valsalva maneuver or during late pregnancy, decreases return.�
Gravity. The effects of gravity on venous return seem paradoxical because when a person stands up hydrostatic forces cause the right atrial pressure to decrease and the venous pressure in the dependent limbs to increase.�This increases the pressure gradient for venous return from the dependent limbs to the right atrium; however, venous return actually decreases.�The reason for this is when a person initially stands, cardiac output and arterial pressure decrease (because right atrial pressure falls).� The flow through the entire systemic circulation falls because arterial pressure falls more than right atrial pressure, therefore the pressure gradient driving flow throughout the entire circulatory system is decreased.
18. Factors increasing PRELOAD: Ventricular filling and therefore preload is increased by:
Increased central venous pressure that can result from decreased venous compliance (e.g., caused by sympathetic venoconstriction) or increased thoracic blood volume. The latter can be increased by either increased total blood volume or by venous return augmented by increased respiratory activity, increased skeletal muscle pump activity, or gravity (e.g., head-down tilt).
Increased ventricular compliance, which results in a greater expansion of the chamber during filling at a given filling pressure.
Increased atrial force of contraction resulting from sympathetic stimulation of the atria or from increased filling of the atria and therefore increased atrial contractile force through the Frank-Starling mechanism.
Reduced heart rate, which increases ventricular filling time.
Increased aortic pressure, which increases the afterload on the ventricle, reduces stroke volume by increasing end-systolic volume, and leads to a secondary increase in preload.
Pathological conditions such as ventricular systolic failure and valve defects such as aortic stenosis, aortic regurgitation (pulmonary valve stenosis and regurgitation have similar effects on right ventricular preload).
19. Factors affecting preload
20. Factors decreasing preload: Ventricular preload is decreased by:
Decreased venous blood pressure, most commonly resulting from reduced blood volume (e.g., hemorrhage) or gravity causing blood to pool in the lower limbs when standing upright.
Impaired atrial contraction that can result from atrial arrhythmias such as atrial fibrillation.
Increased heart rate (e.g., atrial tachycardia), which reduces ventricular filling time.
Decreased ventricular afterload, which enhances forward flow (i.e., ejection) thereby reducing end-systolic volume and end-diastolic volume secondarily.
Ventricular diastolic failure (decreased ventricular compliance) caused, for example, by ventricular hypertrophy or impaired relaxation (lusitropy).
Inflow (mitral and tricuspid) valve stenosis, which reduces ventricular filling.
21. Measurement of CO Echocardiographic techniques and radionuclide imaging techniques can be used to estimate real-time changes in ventricular dimensions, thus computing stroke volume, which when multiplied by heart rate, gives cardiac output.
Fick Principle : An old technique based on the can be used to compute cardiac output (CO) indirectly from whole body oxygen consumption (VO2) and the mixed venous (O2ven) and arterial oxygen contents (O2art); however, this technique is seldom used. The CO is calculated as follows:
������� CO = VO2/(O2art � O2ven)
To calculate CO, the oxygen contents of arterial and venous blood samples are measured, and at the same time, whole body oxygen consumption is measured by analyzing expired air. The blood contents of oxygen are expressed as ml O2/ml blood, and the VO2 is expressed in units of ml O2/min. If O2art and O2ven contents are 0.2 ml and�0.15 ml O2/ml blood, respectively, and VO2 is 250 ml O2/minute, then CO = 5000 ml/min, or 5 L/min. Ventricular stroke volume would simply be the cardiac output divided by the heart rate.