Download
1 / 16
160 likes | 290 Views
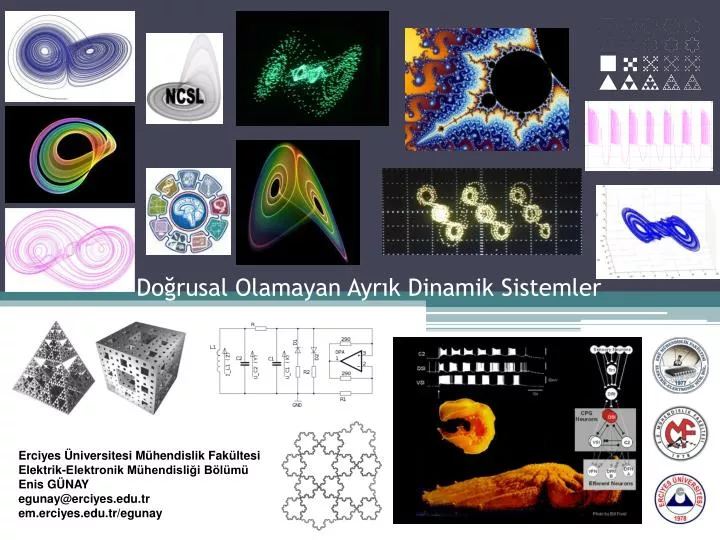
Doğrusal Olamayan Ayrık Dinamik Sistemler. Erciyes Üniversitesi Mühendislik Fakültesi Elektrik-Elektronik Mühendisliği Bölümü Enis GÜNAY egunay@erciyes.edu.tr em.erciyes.edu.tr/egunay. Çadır Haritası ve Grafik İterasyonlar (Tent Map and Graphical Iterations).

E N D
Doğrusal Olamayan Ayrık Dinamik Sistemler Erciyes Üniversitesi Mühendislik Fakültesi Elektrik-Elektronik Mühendisliği Bölümü Enis GÜNAY egunay@erciyes.edu.tr em.erciyes.edu.tr/egunay
Çadır Haritası ve Grafik İterasyonlar (Tent Map and Graphical Iterations) • Tek boyutlu doğrusal olamayan ayrık dinamik sistemlere örnek olarak çadır haritası gösterilebilir.
Örnek • Aşağıda verilen μ ve x0 değerlerine göre Çadır haritası fonksiyonunu hesaplayınız.
Periyod-1 Periyod-2
Grafik Metodu (n=2 için) • Başlangıç değeri x0’dan fonksiyona T(x0) doğru bir dik çizilir. • Bu noktadan y=x köşegenine doğru bir yatay çizilir ve x1=T(x0) bulunur. • (x1,T(x0)) noktasından bir dik çıkılarak T(x1) bulunur. • Bu noktadanbir yatay çizilerek x2=T(x1) bulunur.
Örnek: Aşağıda verilen μ ve x0 değerlerine göre Çadır haritası fonksiyonunu grafik yöntemle hesaplayınız.
nmax=200; t=sym(zeros(1,nmax)); t(1)=sym(2001/10000); mu=2; halfm=nmax/2; axis([0 1 0 1]); for n=2:nmax if (double(t(n-1)))>0 & (double(t(n-1)))<=1/2 t(n)=sym(2*t(n-1)); else if (double(t(n-1)))<1 t(n)=sym(2*(1-t(n-1))); end end end for n=1:halfm t1(2*n-1)=t(n); t1(2*n)=t(n); end t2(1)=0;t2(2)=double(t(2)); for n=2:halfm t2(2*n-1)=double(t(n)); t2(2*n)=double(t(n+1)); end hold on fsize=20; plot(double(t1),double(t2),'r'); x=[0 0.5 1];y=[0 mu/2 0]; plot(x,y,'b'); x=[0 1];y=[0 1]; plot(x,y,'g'); title('Graphical iteration for the tent map') set(gca,'xtick',[0:0.2:1],'FontSize',fsize) set(gca,'ytick',[0:0.2:1],'FontSize',fsize) xlabel('x','FontSize',fsize) ylabel('T','FontSize',fsize) hold off