Download
1 / 16
160 likes | 315 Views
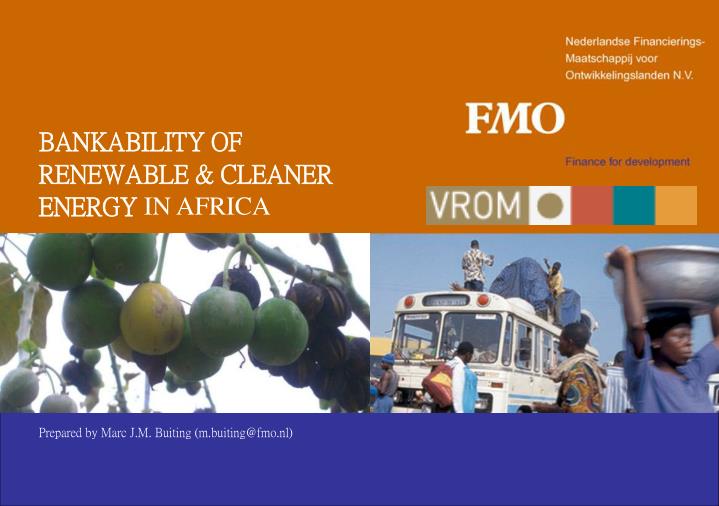
BANKABILITY OF RENEWABLE & CLEANER ENERGY IN AFRICA Prepared by Marc J.M. Buiting (m.buiting@fmo.nl). Renewable Energy. Low impact hydro, run of river or with small storage, seldom > 20MW Geothermal, wind, solar Agricultural and forestry wastes, energy crops

E N D
BANKABILITY OF RENEWABLE & CLEANER ENERGY IN AFRICA Prepared by Marc J.M. Buiting (m.buiting@fmo.nl)
Renewable Energy • Low impact hydro, run of river or with small storage, seldom > 20MW • Geothermal, wind, solar • Agricultural and forestry wastes, energy crops • Waste derived – landfill gas, sewage gas, mass-burn municipal solid waste • Sometimes cogeneration is included
Renewable Energy 5.5 TW in 2020 1997 2020 Increase Capacity Capacity Energy Demand 1995 - 2020 in GW in GW in GW in % 6,000 2,436 3,103 5,515 Hydro 703 1,036 333 47 5,000 1995 - 2020 Capacity Growth 4,000 Wind 1995 - 2020 Capacity Additions 8 63 55 688 3,079 2020 Capacity requirement Capacity in GW 3,000 Repla- cement Biomass 31 54 23 74 667 2,000 1995 Capacity 1,000 Geothermal 8 17 9 113 0 1995 Year 2020 Solar/Other 1 8 8 700 $3,103 billion market of which renewables are likely to represent some 20% (being a market for new-build of some $500 billion). 751 1,178 Total RES As share of World 23% 21% Total World 3,221 5,515 Source: EIA base case expectations; World Economic Outlook 2000/01.
Future holds stronger Role Developing Countries Source: EIA base case expectations; World Economic Outlook 2000/01.
Renewables still less Economic in Cost/kWh Source: PB Power.
Renewables and Direct Government Support EU HIGH Tendering NON-BANKABLE PROJECT Obligation DK Fiscal ES NL IR At T Feed-in Tariffs B Pt L Sw G It Perceived Risk UK Fr Gr BANKABLE PROJECT LOW LOW HIGH Bankability
Governmental Policy Matters Source: World Bank.
Where is Wind Power supposed to be Installed in 2020? 85% of 2001 wind capacity is in OECD countries whereas it is foreseen that half of 2020’s capacity will be in non-OECD countries. Source: Wind Force 12, Greenpeace & EWEA.
Who will Finance the Developing World Projects? Different institutions address different risks: HIGH PUBLIC SECTOR: WORLD BANK PRIVATE SECTOR: DFI’s EXPORT CREDIT AGENCIES PER C E I V E D R I S K INSURANCECOMPANIES COMMERCIAL BANKS BANKABLE INSTITUTIONAL INVESTORS CAPITAL MARKETS LOW LOW HIGH BANKABILITY Only development banks and specific funds available for projects in developing countries.
The General Project (Finance) Feasibility Matrix GOVERNMENT SUPPORT HIGH MARKET ECONOMICS NON-BANKABLE PROJECT PROJECT ECONOMICS FINANCIAL STRUCTURING CONTRACT STRUCTURE Perceived Risk SECURITY PACKAGE • Financial market-forms / financial products • Bond Investor / Lender requirements • Project Sponsor requirements SPONSOR SUPPORT BANKABLE PROJECT LOW LOW HIGH Bankability
Renewable Energy: Main Banking Risks GOVERNMENT SUPPORT • Acceptable country risk? • Regulatory framework IPP’s bankable? • Kyoto signed? (Carbon credits possible?) What scheme to support renewables? MARKET ECONOMICS • Electricity shortages? Base load opportunity? Supportive industry? • Specific sources (such as hydro) available that make other RES less-bankable? • How does specific windpower project compare to other windpower projects? PROJECT ECONOMICS • Technology to be used, efficiencies and track record turbines? Costs per MW? • Use of carbon credits and subsidies from support scheme? • Financing options? CONTRACT STRUCTURE • Single borrower? Long term PPA possible with validity exceeding longest debt tenor? • Turnkey contractor under fixed price date certain contract? • Reputable O&M contractor? (in windparks often equipment vendor) SECURITY PACKAGE • Product warranties? (in windparks generally a minimum of 5 years) • Comprehensive risk coverage available from equipment vendors? • Mortage possible on land or other assets? SPONSOR SUPPORT • Reputable and experienced sponsor? • Level of equity investment? • Level of contingent equity available for completion?
Our Approach is Twofold • FMO takes leading positions in wind and biofuel projects in Africa through structuring projects in a ‘template’ manner (portfolio approach); we support or create developers: • Conventional technologies: Aldwych International • Renewables Wind: Aeolus Africa Development Corporation • Renewables Biofuels: Dutch Jatropha Consortium • FMO focuses on sustainable renewable CDM projects (private sector only) in (non-exclusive) co-operation with the Dutch Ministry VROM.
FMOs Co-operation with the Dutch Ministry of VROM • FMO can make available convertible grants in the feasibility phase of the project (early equity), equity, subordinated loan or senior debt, not necessarily in hard currency. FMO operates as a fully untied institution. • Through the facility FMO offers to a Project a choice is given to the project company in a ‘net’ or ‘gross’ amount. The gross amount includes a facility that will be made available by VROM. • In return for the carbon credits of a project VROM contemplates to fund upfront the net present value of 25% of 70% of the carbon credits cash flow. The other 75% of the 70% are paid against delivery of the carbon credits in the future. The upfront amount need not to be paid back when the rights accompanying this payment are actually delivered. VROM obtaines a purchase option for the remainder 30% of the future carbon credits. Contractual period is preferably 7 or 14 years. • VROM assumes all responsibility for the accreditation process, including the cost involved. In addition, if needed VROM makes capacity development available for the recipient country.
Ministry of VROMs involvement Illustrative bio US$ illustrative 0.3 0.2 VROM provides an AAA-income stream to a project:- 75% of 70% of potential carbon credits contracted (quantity*price)- 30% against future price (option) 0.1 Cash flow for debt service and dividends O&M costs 0 - 0 2 4 6 8 10 12 year -0.5 Investment - 1 After Tax VROM provides a possibility to lower project cost: 25% of 70% of potential carbon credits contracted (quantity*price)
Renewables in Africa differ in Reference Point: Load Curve less important vs cost of HFO/Diesel fired Stations • At reference prices of HFO/Diesel fired stations quite some renewable projects can be made bankable, the more with use of CDM. • Power purchase agreements can be structured with Independent Power Producers at prices of EURct 6 to 9/kWh which still represent a good deal for both parties. • Thank you. Average Generation Price in Africa?