Download
1 / 20
200 likes | 411 Views
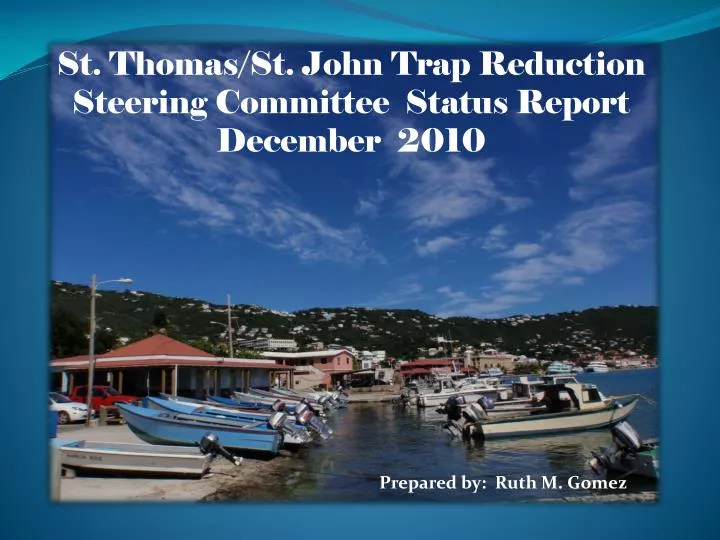
St. Thomas/St. John Trap Reduction Steering Committee Status Report December 2010. Prepared by: Ruth M. Gomez. Prepared by: Ruth M. Gomez. Voting Members:. Louis Blanchard Jr. – Chairman Daryl Bryan – Vice Chairman Julian Magras – Secretary Ricky LaPlace Winston Ledee

E N D
St. Thomas/St. John Trap Reduction Steering Committee Status Report December 2010 Prepared by: Ruth M. Gomez Prepared by: Ruth M. Gomez
Voting Members: • Louis Blanchard Jr. – Chairman • Daryl Bryan – Vice Chairman • Julian Magras – Secretary • Ricky LaPlace • Winston Ledee • Warren Querrad • Michael Berry • Claude Berry • Neville Samuel
Non-Voting Members: • Danny Berry • Robert Berry • Austin Callwood- DPNR- Environmental Enforcement • Ruth Gomez- DPNR- Fish & Wildlife • Catherine Bryan • Jed Brown- DPNR- Fish & Wildlife • Tony Iarocci
Meeting Dates: • June 29, 2010 • July 20, 2010 • August 31, 2010 • September 28, 2010 • October 27, 2010 • November 10, 2010 • December 7, 2010
Types of Traps: • Plastic (lobster) • Typical wire (fish) • St. Barth’s funnel (lobster) • Side funnel (lobster)
Fisher Trap Numbers: Sources included: • USVI Port Sampling data (2009-10) • Commercial Catch Report forms (2005-10) • Trap Design flyer (2010) • Olsen data (2008)
Proposed Tier System • 0-10 • 11-30 • 31-50 • 51-75 • 76-100 • 101-150 • 151-175 • 176-200 • 201-250 Increased permitted Number of traps Decrease mandated REDUCTION = over three (3 )year period 250 maximum number of traps
Percentage Reduction FISH TRAPS ONLY 10% 20% REDUCTION = over three (3 )year period 250 maximum number of traps
Fish trap numbers reported on Trap Reduction Steering Committee flyer
Fish Trap numbers based on highest number reported on Commercial Summary of Catch Report(s) (2005-2010)
Proposed Areas: Discarded Fish Traps DPNR – Division of Fish & Wildlife (Artificial Reef Site Grant)
Fish & Lobster Trap Control Date: • July 20, 2010 • Territorial Sea surrounding St. Thomas/St. John • Proposed by members of the STT/STJ Trap Reduction Steering Committee • Approved by Commissioner Robert Mathes (December 2010)
Lobster Traps: • 600 trap maximum • ALLFISHERS: highest number reported on Commercial Catch Report (July 2009- June 2010)
Acknowledgements: • LynelleDowe - DPNR- Fish & Wildlife • Mekisha George - DPNR- Fish & Wildlife • Gerald GreauxJr - DPNR- Fish & Wildlife • Dr. David Olsen, Ph.D. – Chief Scientist (STFA) • Tony Iarocci