Download
1 / 24
240 likes | 390 Views
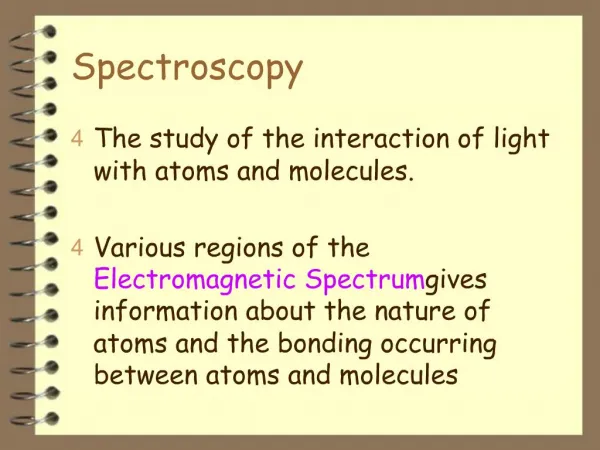
I.R. Spectroscopy. C.I. 6.4. Molecular Spectroscopy. Energy possessed by molecules is quantised . When a molecule interacts with radiation there can be changes in electronic , vibrational or rotational energy. (C.I. 6.2) These changes depend on the frequency of the radiation .

E N D
I.R. Spectroscopy C.I. 6.4
Molecular Spectroscopy • Energy possessed by molecules is quantised. • When a molecule interacts with radiation there can be changes in electronic, vibrational or rotational energy. (C.I. 6.2) • These changes depend on the frequency of the radiation. • Analysis of the energy needed to change from one energy level to another forms basis of molecular spectroscopy.
Infrared Spectroscopy • Substances exposed to radiation from frequency range 1014 Hz to 1013 Hz • (wavelengths 2.5μm -15μm) • causing vibrational energy changes in the molecule • these absorb infrared radiation of specific frequencies. • point is to identify functional groups in the molecule
Remember c = λv from this equation we can get the reciprocal of the wavelength (1/λ) this is a direct measure of the frequency
wavenumber (1/λ) / cm-1 4000 3000 2000 1000 wavelength (λ) / μm 2.5 10 frequency (v) / Hz 1.0 x 10¹⁴ 2.5 x 10¹³ the reciprocal is described as the wavenumberit is the wavenumber, measured in cm-1 that is recorded on an infrared spectrum
Bond deformation • SIMPLE diatomic molecules can only vibrate one way, by stretching. Br H For these molecules there is only one vibrational infrared absorption.
Bond deformation • More complex molecules have more possible deformations O C O symmetric stretch
Bond deformation O C O O C O asymmetric stretch
Bond deformation O C O
Bond deformation O O C
Bond deformation O O C
Bond deformation O O C
Bond deformation O C O
Bond deformation C O O
Bond deformation C O O
Bond deformation C O O bending
Bond deformation • Frequencies are different for each molecule • Energy required for vibration depends on strength of bond • Weaker bonds requiring less energy.
Simple version • Sample placed in ir spectrometer • Subjected to ir radiation • Molecule absorbs energy • Molecule bonds starts to undergo different types of vibration (stretching, bending etc.) • This produces different signals that the detector records as ‘peaks’ on the spectrum.
Important … When an ir spectrum is obtained we do not try to explain the whole thing, simply look for one or two signals that are characteristic of different bonds.
O-H bond stretch C-H bond stretch C-O bond stretch
C-H bond stretch 3010 -2850 cm-1 C-O bond stretch 1050 cm-1 H H C C O-H bond stretch 3670 cm-1 O H H H H
Interpreting the spectra! • Usually match a particular bond to a particular absorption region. • The precise position of the peak depends on the bond environment, so only wavenumber regions can be quoted.
absorption intensity • The strongest (more intense) absorptions occur when a large change in bond polarity associated with the vibration. • e.g. C=O bonds will give more intense absorptions than C=C bonds.
Some typical absorptions • Below 1500cm-1 the ir spectrum can be quite complex • This region is characteristic of a particular molecule • Hence known as ‘fingerprint region’