Download
1 / 116
1.23k likes | 1.99k Views
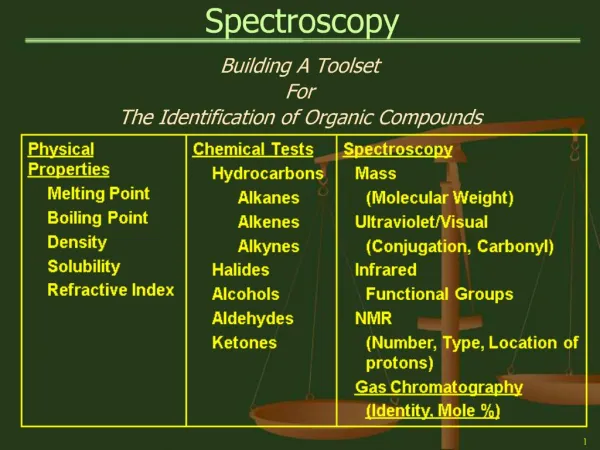
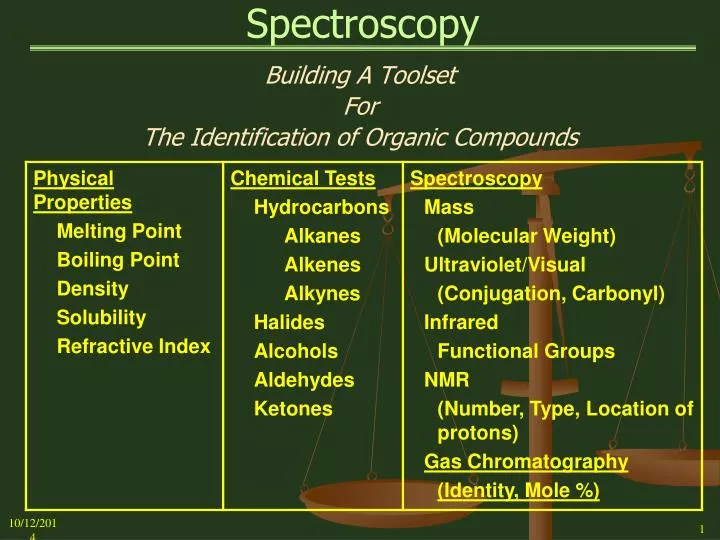
Spectroscopy. Building A Toolset For The Identification of Organic Compounds. Spectroscopy. Spectroscopy Tools. Spectroscopy. Spectroscopy The Absorption of Electromagnetic Radiation and the use of the Resulting Absorption Spectra to Study the Structure of Organic Molecules.

E N D
Spectroscopy Building A Toolset For The Identification of Organic Compounds
Spectroscopy Spectroscopy Tools
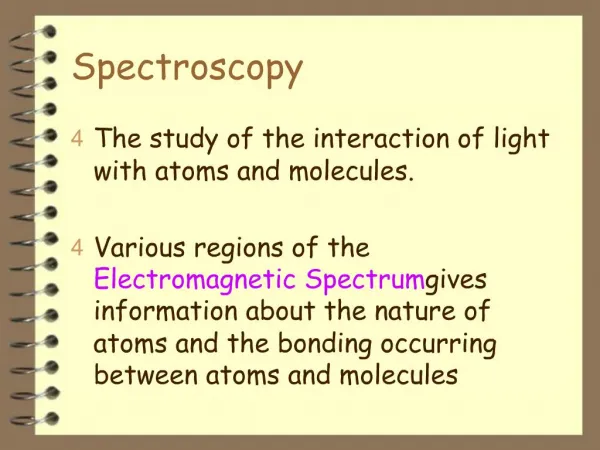
Spectroscopy • Spectroscopy • The Absorption of Electromagnetic Radiation and the use of the Resulting Absorption Spectra to Study the Structure of Organic Molecules. • When continuous radiation passes through a transparent material, some of the radiation can be absorbed. • If the portion that is not absorbed is passed through a prism, a spectrum with gaps is produced. • This is called an: ABSORPTION SPECTRUM
Spectroscopy • Energy States • Energy absorption by transparent materials in any portion of the electromagnetic spectrum causes atoms or molecules to pass from a state of low energy (ground state) to a state of higher energy (excited state). • There are 3 types of Energy States: • Electronic • Vibrational • Spin
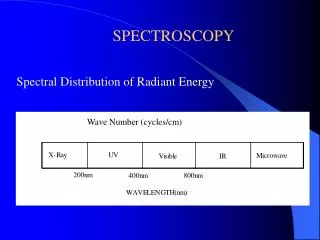
Spectroscopy • Electromagnetic Spectrum Cosmic (Gamma) X-Ray Ultraviolet Visible Infrared Microwave Radio • Energy States and the Electromagnetic Spectrum Electronic – Ultraviolet Vibrational – Infrared Spin – Radio
Spectroscopy Frequency () High Low High Energy (E) Low Short Wavelength () Long Frequency 1.2 x 10¹⁴ Hz 3 x 10⁸ Hz 3 x 10¹⁹ Hz 3 x 10¹⁶ Hz 1.5 x 10¹⁵ Hz 2 x 10¹³ Hz 3 x 10¹¹ Hz 1 x 10⁹ Hz 6 x 10⁷ Hz 4 x103cm-1 1.25 x104cm-1 Wave Number 2.5 x104cm-1 0.002 cm-1 0.01 cm-1 1 x109cm-1 1 x107cm-1 5 x104cm-1 667cm-1 10 cm-1 3 cm-1 Cosmic & Ray Vacuum UV X-Ray Infrared Microwave Radio Frequency 1 mm 30 cm 1 m 5 m 0.01 nm 10 nm Wavelength 200 nm 2.5 15 400 nm 800 nm Near Ultraviolet Visible Nuclear Magnetic Resonance Vibrational Infrared Blue Red
Spectroscopy Quantization The excitation process is quantized, in which only selected frequencies of energy are absorbed representing the energy difference (E) between the excited and ground states. E = [E (excited) – E (ground)] = h = c / E = hc / Where: = Frequency (Hz) c = Velocity of Light (cm/sec) = Wavelength (cm) h = Planck’s Constant
Spectroscopy Spectroscopy Types: • Mass Spectrometry (MS) – Hi-Energy Electron Bombardment Use – Molecular Weight, Presence of Nitrogen, Halogens • Ultraviolet Spectroscopy (UV) – Electronic Energy States Use –Conjugated Molecules; Carbonyl Group, Nitro Group • Infrared Spectroscopy (IR) – Vibrational Energy States Use – Functional Groups; Compound Structure • Nuclear Magnetic Resonance (NMR) – Nuclear Spin States Use – The number, type, and relative position of protons (Hydrogen nuclei) and Carbon-13 nuclei
Mass Spectroscopy • High energy electrons bombard organic molecules breaking some or all of the original molecules into fragments. • The process usually removes a single electron to produce a positive ion (cation radical) that can be separated in a magnetic field on the basis of the mass / charge ratio. • Removal of the single electron produces a charge of +1 for the cation. • Thus, the cation represents the Molecular Weight of the original compound or any of the fragments that are produced. • The mass spectrum produced is a plot of relative abundance of the various fragments (positively charged cation radicals) versus the Mass / Charge (M/Z) ratio. • The most intense peak is called the “Base Peak”, which is arbitrarily set to 100% abundance; all other peaks are reported as percentages of abundance of “Base Peak.”
Mass Spectroscopy M + e- M+ + 2e- Molecule High Energy Electron Molecular Ion (Radical Cation) 1-Pentanol - MW 88CH3(CH2)3 – CH2OH M - (H2O and CH2 – CH2) Base Peak M - (H2O and CH3) Typical Mass Spectrum M - H2O CH2OH Molecular Ion Peak (M+ 88)
Mass Spectroscopy • Molecular Ion Peak (M+) • Largest mass/charge ratio • Always the last peak on the right side of spectrum • May or may not be the base peak (usually not)! • Abundance can be quite small, i.e., very small peaks • The Molecular Ion Peak represents the Molecular Weight of the Compound
Mass Spectroscopy Methyl Propyl Ketone (C5H10O) (CAS 107-87-9) M+ – 43(C2C2CH3) lostPropyl Group M+ – 28(CH2CH2) lost Molecular Ion Peak M+ – 15(CH3) lost M+ 86
Mass Spectroscopy • The Presence of Nitrogen in the Compound • If the Mass / Charge (m/z) ratio for the Molecular Ion peak is “Odd”, then the molecule contains an Odd number of Nitrogen atoms, i.e., 1, 3, 5, etc. Note: An “Even” value for the Mass / Charge ratio could represent a compound with an even number of Nitrogen atoms, i.e., 0, 2, 4 etc. • The actual presence of Nitrogen in the compound is not explicitly indicated as it is with an “Odd” value for the ratio.
Mass Spectroscopy • Halogens in Organic Compounds • Most elements exist in several isotopic forms: Ex. 1H1, 2H1, 12C6, 13C6, 35Cl17, 37Cl17, 79Br35, 81Br35 • “Average Molecular Weight” The average molecular weight of “All” isotopes of a given element relative to the abundance of the each isotope in nature • “Integral Molecular Weight” The Number of Protons and Neutrons in a specific isotope Each fragment represented in a Mass Spectrum produces several peaks each representing a particular isotopic mixture of the elements in the compound, i.e., an “integral molecular weight.
Mass Spectroscopy • The Presence of Chlorine in a Compound • The two (2) principal Chlorine Isotopes in nature areCl-35 and Cl-37 (2 additional Neutrons in Cl-37) • The relative abundance ratio of Cl-35 to Cl-37 is: 100 : 32.6 or 75.8 : 24.2 or 3 : 1 • Therefore, a Molecule containing a single Chlorine atom will show two Mass Spectrum Molecular Ion peaks, one for Cl-35 (M+) and one for Cl-37 (M+2) Note: M+2 denotes 2 more neutrons than M+ • Based on the natural abundance ratio of 100 / 32.6 (about 3:1), the relative intensity (peak height) of theCl-35 peak will be 3 times the intensity of the Cl-37 peak
Mass Spectroscopy • The Presence of Chlorine in a Compound (Con’t) 1-Chloropropane Molecule contains 1 Chlorine atom resulting in two Molecular Ion Peaks of about 3:1 relative intensity, based on the 3:1 natural abundance ratio ofCl-35 / Cl-37 Molecular Ion Peaks M+ 78: M+2 80 very small
Mass Spectroscopy • The Presence of Bromine in a Compound • The two (2) principal Bromine Isotopes in nature areBr-79 and Br-81 (2 additional Neutrons in Br-81) • The relative abundance ratio of Br-79 to Br-81 is 100 : 97.1 or 50.5 : 49.5 or 1 : 1 • Molecules containing a single Bromine atom will also show two molecular ion peaks one for Br-79 (M+) and one for Br-81 M+2 • Based on the natural abundance ratio of 100 / 97.1 (about 1:1), the relative intensity of the Br-79 peak will be about the same as the Br-81 peak
Mass Spectroscopy • The Presence of Bromine in a Compound (Con’t) 3-Bromo-1-Propene Molecule contains 1 Bromine atom resulting in two Molecular Ion Peaks of about 1:1 relative intensity, based on the 50.5:49.5 (1:1) natural abundance ratio ofBr-79 / Br-81 Molecular Ion Peaks M+ 120; M+2 122
Mass Spectroscopy The Presence of Fluorine in a Compound • Fluorine exists in nature principally as a single isotope19F9 • A compound containing any number of Fluorine atoms will have a single Molecular Ion peak (assuming no other Halogens present)
Mass Spectroscopy • Multiple Halogens in a Compound • Compounds containing two (2) Chlorine atoms will produce three (3) Molecular Ion peaks representing the 3 possible isotope combinations of Chlorine: 35Cl1735Cl17(Rel Peak Intensity - 100.0) 35Cl1737Cl17 (Rel Peak Intensity - 65.3) 37Cl1737Cl17(Rel Peak Intensity - 10.6)
Mass Spectroscopy • Multiple Halogens in a Compound • Compounds containing three (3) Chlorine atoms will produce four (4) Molecular Ion peaks representing the 4 possible isotope combinations for Chlorine: 35Cl1735Cl1735Cl17(Rel Peak Intensity - 100.0) 35Cl1735Cl1737Cl17 (Rel Peak Intensity - 97.8) 35Cl1737Cl1737Cl17(Rel Peak Intensity - 31.9) 37Cl1737Cl1737Cl17 (Rel Peak Intensity - 3.5)
Mass Spectroscopy & Molecular Formula • Information from the Mass Spectrum can used to determine the Molecular Formula of a compound Ex. Molecular Ion Peaks – M+ 94; M+2 96 (95) 2 Molecular Ion Peaks (3:1) suggest: 1 Chlorine atom Partial Analysis: C – 25.4%; H – 3.2 % Use 95 as average molecular weight Carbon: 95 x 0.254 = 24.1 / 12 = 2 C atoms Hydrogen: 95 x 0.032 = 3.0 / 1 = 3 H atoms 95 – (24 + 3) = 68 unresolved mass (Use oxygen, nitrogen, halides (Cl or Br) to resolve mass) 2 Oxygen (16 + 16) + 1 Chlorine (35.5) 68 Molecular Formula - C2H3O2Cl
Mass Spectroscopy • Summary • Fragmentation of Organic Molecules by high energy electrons • Base Peak – 100 % abundance • Molecular Ion Peak – Highest Mass/Chargeratio • Molecular Ion Peak – Last peak(s) on right side of chart • Molecular Ion Peak – Represents Molecular Weight of compound • Molecular Ion Peak – If value is “Odd” the compound contains an odd number of “Nitrogen” atoms • Molecular Ion Peak – If two peaks occur and the relative abundance ratio is 3:1, then the compound contains a single Chlorine atom. • Molecular Ion Peak – If two peaks occur and the relative abundance ration is 1:1, then the compound contains a single Bromine Atom
Ultraviolet/Visible (UV) Spectroscopy • UV-Visible Spectrum : 190 nm – 800 nm • In Ultraviolet and Visible Spectroscopy, the energy absorption transitions that occur are between electronic energy levels of valence electrons, that is, orbitals of lower energy are excited to orbitals of higher energy • Thus, UV / Visible spectra often called Electronic Spectra • All organic compounds absorb Ultraviolet light to some degree, but in many cases at such short wavelengths to make its utility of very limited value in organic chemistry • For the purpose of this course, the primary use of UV/Vis will be to confirm: • The presence of conjugated molecules, either aliphatic alkene structures or aromatic ring structures • To a lesser degree, the presence of the Carbonyl group and the Nitro group
Ultraviolet/Visible (UV) Spectroscopy • When a molecule absorbs radiation a valence electron is generally excited from its highest occupied molecular orbital (HOMO) to the lowest unoccupied molecular orbital (LUMO) • For most molecules, the lowest energy orbitals are thesigma () orbitals ( - bonds) • The electrons of sigma bonds are too tightly bound to be promoted by radiation in the 200-700 nm region. • Therefore alkanes, saturated alcohols, simple alkenes show no or very little UV absorption. • The orbitals occupy somewhat higher energy levels. • Orbitals that hold unshared pairs of electrons, the nonbonding (n) orbitals, lie at even higher energies. • Unoccupied or antibonding orbitals (* and *) have the highest energies.
Ultraviolet/Visible (UV) Spectroscopy • Chromophores • The absorption of Ultraviolet radiation results from the excitation of electrons from ground to excited state • The Nuclei in molecules, however, determine the strength with which electrons are bound to the molecule, thus, influencing the spacing between ground and excited states • The characteristic energy of a transition and the wavelength of radiation absorbed are properties of a group of atoms rather than the electrons themselves. • The group of atoms producing such an absorption is called a Chromophore. • As the structure of the molecule (alkane, alkene, alkyne, alcohol, amine, nitrile, carbonyl, etc.) changes, the energy and intensity of the Ultraviolet absorption will change accordingly
Ultraviolet/Visible (UV) Spectroscopy • Radiation in the range 190nm – 800nm causes valence electrons (those that participate in bonding) to be excited to a higher energy level. • The ground state of an organic molecule can contain valence electrons in three principal types of molecular orbitals: (sigma) (pi) n (non-bonding) C : H Sigma & pi bonds have antibonding (unocuupied) orbitals associatedwith them * & * C::C
Ultraviolet/Visible (UV) Spectroscopy Energy Transition Examples n * in carbonyl compounds n * in oxygen, nitrogen, sulfur, and halogen compounds * in alkenes, alkynes, carbonyl and azo compounds * in carbonyl compounds * in alkanes IncreasingEnergy Antibonding (single bonds) Antibonding (double bonds) • * * n IncreasingEnergy Nonbonding (as in lone electron pairs or the propenyl (allyl) radical Bonding (double bonds) Bonding (single bonds) Note: Electronic energy levels in aromatic molecules are more complicated than are presented here.
Ultraviolet/Visible (UV) Spectroscopy • Atoms produce sharp lines of absorption • Molecules have many excited modes of vibration and rotation at room temperature. The rotational and vibrational levels are superimposed on the electronic levels • Electron transitions may occur from any of several vibrational and rotational states of one electronic level to any of several vibrational and rotational states of a higher electronic level. • Thus, the UV spectrum of a molecule consists of a broad band of absorption centered near the wavelength of the major transition, i.e. where the radiation has its maximum absorption (max).
Ultraviolet/Visible (UV) Spectroscopy • The Ultraviolet-Visible spectrum is generally recorded as a plot of absorbance versus wavelength; but the plot is more often presented with the Absorptivity () or log plotted on the ordinate (y-axis) and the wavelength plotted on the abscissa (x-axis) Ex: Cyclohexane (A Conjugated Aromatic Molecule) Wavelength of Maximum Absorbancemax – 230 nm ************************ Molar Absorptivity – 15,000 cm-1 Log – 4.2
Ultraviolet/Visible (UV) Spectroscopy • The Beer-Lambert Law • The Ultraviolet/Visible Spectrum is a plot of the Wavelength () in nanometers (nm) over the entire Ultraviolet / Visible region versus the Absorbance (A) of the radiation at each wavelength. A = log (Ir / Is) = C L Is = Intensity of light through sample solution Ir = Intensity of incident light passing through Reference cell = Molar Absorptivity (Molar Extinction Coefficient) A measure of the strength or intensity of the absorption. Units – l/(mol • cm) (m2 x 10-2/mol) (mmol/dm3) C = Concentration of solute (mol/L) or (g/L) if molecular mass is unknown L = Length of cell (cm)
Ultraviolet/Visible (UV) Spectroscopy A = • C • l = A / (C • l ) • Values of are usually expressed as Log • Aliphatic (single band) = 10,000 – 20,000 (Log = 4.0 – 4.3) • Aromatic (two bands = 1,000 – 10,000 (Log = 3.0 – 4.0) • Carbonyl compounds = 10 – 100 (Log = ~ 2) • Nitro compounds = 10 (Log = ~ 1)
Ultraviolet/Visible (UV) Spectroscopy • Typical Transitions & Associated Wavelengths of Maximum Absorption and Molar Absorptivities
Ultraviolet/Visible (UV) Spectroscopy Typical Transitions and Absorptionsof Simple IsolatedChromophores
Ultraviolet/Visible (UV) Spectroscopy • Computation Example: • An -unsaturated ketone of relative molecular weight 110 has an absorption band with max at 215 nm and = 10,000 (l / mol • cm) • A solution of this ketone showed absorbance A = 2.0 with a 1 cm cell. Calculate the concentration of the ketone in this solution expressed in grams per liter. Ans: A = c L c = A / L c = 2.0 / ((10,000 l/mol • cm) * 1.0 cm) c = 2 x 10⁻⁴ mol/l c = 2 x 10⁻⁴ mol/l x 110 g/mol c = 2.20 x 10⁻² g/l
Ultraviolet/Visible (UV) Spectroscopy Computation Example: Calculate the Molar Absorptivity, , for a solution containing 1.0 mmol dm-3 (1.0 x 10⁻³ moles per liter) of solute, when the absorbance of a 1 cm cell was 1.5. Ans: A = c L = A / c L = 1.5 / (1 x 10⁻³ mol / L) (1 cm) = 1.5 x 10³ L / mol • cm What would be the Absorbance for a solution of double this concentration? Ans: A = 1.5 x 10³ L / mol • cm • 2.0 x 10⁻³ moles / L • 1 cm A = 3.0
Ultraviolet/Visible (UV) Spectroscopy • Alkanes • Contain single sigma bonds resulting in only * transitions which absorb ultraviolet radiation at wavelengths generally too short for use in UV spectroscopy. Utility: None • Alcohols, Ethers, Amines, Sulfur Compounds • The n * transitions absorb UV radiation within the experimentally accessible range (>180 nm). Utility: Very little
Ultraviolet/Visible (UV) Spectroscopy • Alkenes and Alkynes Absorb UV radiation in the range < 180 nm. “Cumulated” alkenes ( * transitions), which have one or more “” sigma bonds between the double bounds usually have absorption maxima below 200 nm. Utility: Very little • Compounds with Oxygen double bonds Unsaturated molecules containing oxygen or nitrogen structures such as Carbonyl (C=O) and Nitro (NO2) have both n * (280 - 290 nm) and * transitions (188 nm). Utility: Moderate
Ultraviolet/Visible (UV) Spectroscopy • Conjugated unsaturated systems are molecules with two or more double or triple () bonds each alternating with a single or sigma bond (). • Conjugated unsaturated systems have delocalized bonds, i.e., a p-orbital on an atom adjacent to a double bond producing * transitions. • Single electron as in the allyl radical (CH2=CHCH2•) • Vacant p orbital as in allylcation (CH2=CHCH2+) • P orbital of another double bond (CH2=CHCH=CH2 • Conjugated systems include the Aliphatic Alkenes as well as the Aromatic ring structures. Compounds whose molecules contain conjugated multiple bonds absorb strongly in the UV / Visible portion of the electromagnetic spectrum (> 200 nm). Utility: Good
Ultraviolet/Visible (UV) Spectroscopy • Conjugated Unsaturated Systems • Conjugated systems consist of alternating sigma () bonds and pi () bonds) and the Ultraviolet absorptions show large values of 2,5-Dimethyl-2,4-Hexadiene (in Methanol) • The Wavelength of Maximum Absorption ( max ) is obtained from the Absorption Spectrum Wavelength of Maximum Absorbance (max) – 242.5 nm Molar Absorptivity ( ) – 13,100 M-1 cm-1 (Log = 4.1)
Ultraviolet/Visible (UV) Spectroscopy • Conjugated Unsaturated Systems (Con’t) • , - Unsaturated ketones, Dienes, Polyenes Transitions - * High Intensity Bands = 10,000 to 20,000 (log = 4.0 - 4.3) max > 210 nm • Aromatic Conjugated Systems Transitions - * 2 Medium Intensity Bands = 1000 - 60,000 (log = 3.0 - 4.8) max both bands > 200 nm Note: Substitution on ring increases Molar Absorptivity above 10,000
Ultraviolet/Visible (UV) Spectroscopy • Carbonyl (C=O), Nitro Group (NO2) (Resonance effects on substituted benzene) • Transitions n - * & * • Single Low Intensity Band = 10 (log = 1) to = 300 (log = 2.5) max (250 - 360 nm) • Nitro (NO2) log (~1.0) • Carbonyl (C=O) log (~2.0) • The presence of these functional groups should be used only as confirmations of species identified in the IR Spectra.
Ultraviolet/Visible (UV) Spectroscopy • Practical Approach to Interpreting UV/Vis Information • If the problem you are working on provides an UV/Vis spectrum and it indicates “No” absorption in the 200 – 700 nm range, the following conclusions are applicable: • The compound is not conjugated, i.e., it does not contain alternating double/single bonds (including Benzene ring.) • The compound probably does not contain “Carbonyl” or “Nitro” groups (confirm with IR). • If the problem provides Log Absorptivity values (Log ) the following possibilities exist: • Log (> 4.0) - Conjugated , - Unsaturated ketones, Dienes, Polyenes • Log (3.0 – 4.0) - Aromatic ring (Check IR, NMR) • Log (1.5 – 2.5) - C=O (Check IR) • Log (1.0 – 1.5) - NO2 (Check IR)
Infrared Spectroscopy • Infrared Spectroscopy References • Pavia, et al - pp. 851 - 886 • Solomon’s et al - pp. 79 - 84; 821 – 822 • Infrared Radiation • That part of the electromagnetic spectrum between the visible and microwave regions 0.8 m (12,500 cm-1) to 50 m (200 cm-1). • Area of Interest in Infrared Spectroscopy The Vibrational portion of infrared spectrum 2.5 m (4,000 cm-1) to 25 m (400 cm-1) • Radiation in the vibrational infrared region is expressed in units called wavenumbers ( )
Infrared Spectroscopy • Wavenumbers are expressed in units of reciprocal centimeters (cm-1) i.e. the reciprocal of the wavelength () expressed in centimeters. (cm-1) = 1 / (cm) • Wave Numbers can be converted to a frequency () by multiplying them by the speed of light (c) in cm/sec (Hz) = c = c / (cm /sec /cm = 1/sec) Recall: E = h c / • Thus, wavenumbers are directly proportional to energy
Infrared Spectroscopy • Polar Covalent Bonds & Dipole Moments • Organic compounds are organized into families of compounds on the basis of certain groupings of atoms, i.e., Functional Groups. • The Electrons between atoms in an organic compound are shared forming “Covalent bonds.” • Covalent bonds between atoms with different electronegativities have an unequal sharing of the bond electrons setting up an electrostatic charge difference between the atoms. • The atom with the greater Electronegativity pulls the electrons closer to it forming a “Polar Covalent Bond.”
Infrared Spectroscopy • Polar Covalent Bonds & Dipole Moments (Con’t) • The relative strength of the Polar Covalent Bond impacts the ability of the molecule, i.e., a Functional Group, to attract or repel other polar entities (functional groups). • The separation of the positive and negative charges in a Polar Covalent Bond is referred to as a Dipole. • A dipole has a Dipole Moment defined as the product of the magnitude of the partial charges (in electrostatic units, esu) times the distance (in cm) of separation. • Only those Covalent bonds with Dipole Moments are capable of absorbing Infrared Radiation.
Infrared Spectroscopy • The Radiation (Energy) Absorption Process • The absorption of Infrared Radiation by a Polar Covalent Bond raises the molecule to a higher energy state. • This is a Quantized process in which only selected frequencies are absorbed dependent on the relative masses of the atoms, the force constants of the bond (electronegativity), and the geometry of the atoms. • Covalent Bonds possess Rotational and Vibrational frequencies. • Every type of bond has a natural frequency of vibration. • The same bond in different compounds has a slightly different frequency of vibration.
Infrared Spectroscopy • When the frequencies of Infrared Radiation match the natural vibrational frequencies of a bond with a Dipole Moment, the radiation is absorbed increasing the amplitude of the vibrational motions of the covalent bonds. • Infrared radiation is absorbed and converted by organic molecules with polar covalent bonds and dipole moments into energy of molecular rotation and molecular vibration. • Rotation - Less than 100 cm-1(Spectrum is lines) • Vibration - 10,000 cm-1 to 100 cm-1 (Spectrum is bands) • The vibrationalbands appears because each vibrational energy change is accompanied by a number of rotational changes • Infrared Spectroscopy is concerned only with the vibrational spectrum (4,000 cm-1 to 400 cm-1)
Infrared Spectroscopy • Molecular Vibrations • Absorption of infrared radiation corresponds to energy changes on the order of 8-40 KJ/mole (2-10 Kcal/mole • The frequencies in this energy range correspond to the stretching and bending frequencies of the covalent bonds with dipole moments. • Stretching (requires more energy than bending) • Symmetrical • Asymmetrical • Bending • Scissoring (in-plane bending) • Rocking (in-plane bending) • Wagging (out-of-plane bending) • Twisting (out of plane bending)