Download
1 / 11
110 likes | 266 Views
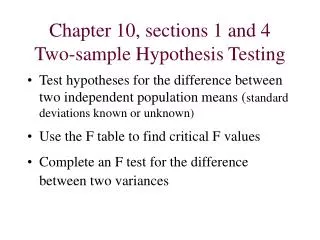
Chapter 10, sections 1 and 4 Two-sample Hypothesis Testing. Test hypotheses for the difference between two independent population means ( standard deviations known or unknown) Use the F table to find critical F values Complete an F test for the difference between two variances.

E N D
Chapter 10, sections 1 and 4Two-sample Hypothesis Testing • Test hypotheses for the difference between two independent population means (standard deviations known or unknown) • Use the F table to find critical F values • Complete an F test for the difference between two variances
Difference Between Two Means Goal: Test hypothesis or form a confidence interval for the difference between two population means, μ1 – μ2. Assumptions: • Different data sources-- populations are Unrelated and Independent • two samples are randomly and independently drawn from these populations. • Sample selected from one population has no effect on the sample selected from the other population • population distributions are normal or both sample sizes are 30
Possible Hypotheses Are: Upper-tail test: H0: μ1≤μ2 H1: μ1>μ2 i.e., H0: μ1 – μ2≤ 0 H1: μ1 – μ2> 0 Lower-tail test: H0: μ1μ2 H1: μ1 < μ2 i.e., H0: μ1 – μ2 0 H1: μ1 – μ2< 0 Two-tail test: H0: μ1 = μ2 H1: μ1≠μ2 i.e., H0: μ1 – μ2= 0 H1: μ1 – μ2≠ 0
Population standard deviations are known, σ1 and σ2 known, use Z test. • The test statistic for μ1 – μ2 , based on sample sample means, is: • The Confidence interval for μ1 – μ2 is:
σ1 and σ2 Unknown Assumptions: • Samples are randomly and independently drawn • Populations are normally distributed or both sample sizes are at least 30 • Population variances are unknown but assumed equal, σ1 and σ2 unknown, but known to be equal • The population variances are assumed equal, so use the two sample standard deviations and pool them to estimate σ • The test Statistic for μ1 – μ2 has a t distribution with a degree of freedom of (n1+n2-2):
Where: • The confidence interval for μ1 – μ2 is: • Example: • Last week you were given a sample of 69 beer, 54 are U.S.-made and 15 are foreign-made. Additional information were provided with respect to price, calories, and percent alcohol content. • Let’s assume the two populations are unrelated, independent, and approximately normally distributed with equal variance • Assume that the two samples are independently drawn.
Questions: • Is there evidence of a difference in mean calories of us and non-U.S. beers? • What is the 95% confidence interval for the difference in mean calories? • Are conclusions in 1 and 2 consistent? • U.S. beers have about 10% more alcohol than non-U.S. beers. • Is the assumption of equal population variances, that you used for 1 and 4 a valid assumption? • Is there evidence that there is less variation in price of imported beers than price of domestic beers
Hypothesis Tests for Variances • Test of two population variances • Hypotheses: H0: σ12 / σ22=1 H1: σ12 / σ22≠1 H0: σ12 = σ22 H1: σ12 ≠ σ22 Two-tail test H0: σ12σ22 H1: σ12 < σ22 H0: σ12 / σ221 H1: σ12 / σ22 <1 Lower-tail test H0: σ12 ≤ σ22 H1: σ12 > σ22 H0: σ12 / σ22 ≤1 H1: σ12 / σ22 >1 Upper-tail test
The test statistic from samples is • F-Distribution can take values from 0 to infinity • It is a right-skewed distribution = Variance of Sample 1 n1 - 1 = numerator degrees of freedom = Variance of Sample 2 n2 - 1 = denominator degrees of freedom
Finding the critical lower and upper tail values • Find FU from the F table for n1 – 1 numerator and n2 – 1 denominator degrees of freedom • Find FL using the formula: • Where FU* is from the F table with n2 – 1 numerator and n1 – 1 denominator degrees of freedom (i.e., switch the d.f. from FU) H0: σ12 = σ22 H1: σ12 ≠ σ22 /2 /2 Do not reject H0 0 F FL FU