Download
1 / 39
390 likes | 403 Views
Statistical Decision and 1-Sample Hypothesis Testing. (Lesson - 04/C) Comparing Against a Cut-off point. Statistical Decision: Hypothesis Testing.

E N D
Statistical Decision and 1-Sample Hypothesis Testing (Lesson - 04/C) Comparing Against a Cut-off point Dr. C. Ertuna
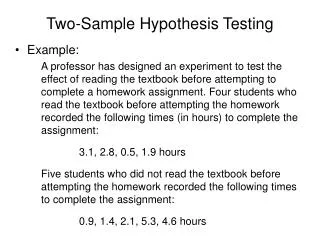
Statistical Decision: Hypothesis Testing The State Insurance Fund is sued by an individual. She complains that the average processing time of the fund exceeds the legally mandated average of 25 days. To settle the dispute you randomly select 64 claims with a mean value of 26 days and a standard deviation of 3 days and conduct a test. Does the State Insurance Fund takes more than 25 days to process a claim at 90% confidence level? Dr. C. Ertuna
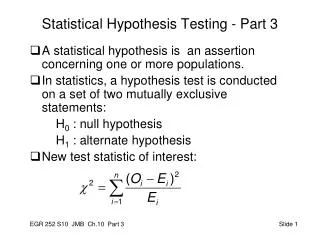
Statistical Decision: Hypothesis Testing To answer this question we need to compare sample statistics(the mean value of processing time) value with the population parameter. This is called single sample Hypothesis testing. Dr. C. Ertuna
sample-A sample-A population-I population-I Parameter of the sample is not different than the cut-off point Parameter of the sample is different than the cut-off point 1-Sample Hypothesis Testing Dr. C. Ertuna
1-Sample Hypothesis Testing • For one tailed tests: Put “Claim” and “Harder to prove” statements into Ha: For two tailed test: Put “equal to” into Ho: • Wright Null (Ho:) and Alternative (Ha:) Hypotheses in daily language; It must be in line with the problem and must include the following three information: • “Mean” (Average) or “Variance” (St.Dev) or “Proportion” • A cut-off point • A comparison statement like the following: • Less than / Less than or equal to • More than / More than or equal to • Equal to / Not equal to • Determine tails of test (1-tailed or 2-tailed test) – Look into Ha: • More than / More than or equal to Upper tail test • Less than / Less than or equal to Lower tail test • Equal to / Not equal to 2-tailed test • Decide • p_value >a Accept Ho: • p_value < a Accept Ha: Dr. C. Ertuna
One-Tailed Hypothesis Tests A one-tailed hypothesis test is a test in which the entire rejection region is located in one tail of the test statistic’s distribution. Dr. C. Ertuna
One-Tailed Hypothesis Tests 0 Dr. C. Ertuna
One-Tailed Hypothesis Tests 0 Dr. C. Ertuna
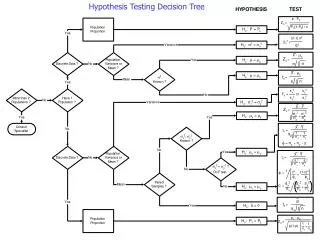
Statistical Decision: Hypothesis Testing To compare a sample statistics with a population parameter we have (in general) 3 methods. • Direct Comparison • Indirect Comparison where, Indirect Comparison has two alternatives. Dr. C. Ertuna
Single Sample Hypothesis Test for the Mean: Decision Methods Dr. C. Ertuna
Establishing the Decision Rule Dr. C. Ertuna
1-Sample Mean Test Cut-off value a ( = 1-Confidance Level) If Sample Statistics are known If observations are given, PhStat will compute Sample Statistics automatically Determined by guidelines and Ha: PhStat / One-Sample Tests / t-Test for the Mean, sigma unknown Dr. C. Ertuna
Establishing the Decision Rule The p-value refers to the probability (assuming the null hypothesis is true) of obtaining a test statistic at least as extreme as the test statistic we calculated from the sample. The p-value is also known as the observed significance level. Dr. C. Ertuna
Relationship Between the 3 Methods Rejection region = 0.10 p-value = 0.0049 0.5 0.4 0 Dr. C. Ertuna
Summary of Hypothesis Testing Process The hypothesis testing process can be summarized in 6 steps: • Determine the null hypothesis and the alternative hypothesis. • Determine the desired significance level (). • Define the test method and sample size and determine a critical value. • Select the sample, calculate sample mean, and calculate the z-value or p-value. • Establish a decision rule comparing the sample statistic with the critical value. • Reach a conclusion regarding the null hypothesis. Dr. C. Ertuna
Two-Tailed Hypothesis Tests A two-tailed hypothesis test is a test in which the rejection region is split between the two tails of the test statistic’s distribution. Dr. C. Ertuna
Two-Tailed Hypothesis Tests 0 Dr. C. Ertuna
Example: Two-Tailed Hypothesis Test for the Mean A company packages peanuts in 16-ounce sacks. Company is concerned that the true average fill may greater than 16 ounces (lost profit) or less than 16 ounces (shortchanging customers). Each day company select a random sample of 40 sacks. On a particular day sample mean is 16.42 ounces and standard deviation 0.80 ounces. Using 90% confidence level, do you thing filling is okay? Dr. C. Ertuna
H0: = 16 ounces HA: = 16 ounces Example: Two-Tailed Hypothesis Test fro the Mean Please formulate the Hypothesis : Dr. C. Ertuna
Example: Two-Tailed Hypothesis Test for the Mean Using p-value, would you reject the null hypothesis? Dr. C. Ertuna
The Decision Rule Dr. C. Ertuna
Type II Errors • A Type II error occurs when a false hypothesis is accepted. • The probability of a Type II error is given by the symbol. • and are inversely related. Dr. C. Ertuna
Power of the Test The power of the test is the probability that the hypothesis test will reject the null hypothesis when the null hypothesis is false. Power = 1 - Dr. C. Ertuna
Single Sample - Hypothesis Test for Proportion • The null and alternative hypotheses are stated in terms of and the sample values become p. • The null hypothesis should include an equality. • The significance level determines the size of the rejection region. • The test can be one- or two-tailed depending on the situation being addressed. Dr. C. Ertuna
Single Sample Hypothesis Test for Proportion Z-test Statistics for Proportions where: p = Sample proportion 0 = Hypothesized population proportion n = Sample size Dr. C. Ertuna
Single Sample Hypothesis Test for Proportion PHStat2 / (One)-Sample Test / Z-test for Proportion Z-test Statistics for Proportions Dr. C. Ertuna
1-Sample Proportion Test Cut-off value a ( = 1-Confidance Level) If not directly given, then it should be computed using proportion and n Determined by guidelines and Ha: PhStat / One-Sample Tests / Z-Test for the Proportion Dr. C. Ertuna
Single Sample Hypothesis Test for Variance Chi-Square Test for a single Population Variance where: 2 = Chi-square test statistics n = Sample size s2 = Sample variance 2 = Hypothesized variance Dr. C. Ertuna
Single Sample Hypothesis Test for Variance PHStat2 / (One)-Sample Test / Chi-Square Test for Variance Chi-Square Test for a single Population Variance Dr. C. Ertuna
1-Sample Variance Test VARIANCE value - Cut-off value a ( = 1-Confidance Level) Std. Dev. of the Sample Determined by guidelines and Ha: PhStat / One-Sample Tests / Chi-Square Test for the Variance Dr. C. Ertuna
Example: Single SampleHypothesis Tests for Variances As a hotel manager you would like to check your room service quality in terms of speed. You believe that the mean service time should be 6 minutes with a standard deviation of not exceeding 2 minutes. If standard deviation exceeds 2 minutes customers complain, thus the phone traffic, hence the workload at front desk increases. Based on a sample of 20 service calls you found a standard deviation of 2.3 minutes. At 90% Confidence level do you think that your service speed is acceptable? Dr. C. Ertuna
Example: Single Sample Hypothesis Tests for Variances Hypothesis H0: 20 (4 minutes2) HA: > 20 (4 minutes2) = 0.10 Dr. C. Ertuna
Example: Single SampleHypothesis Tests for Variance Dr. C. Ertuna
Example: Hypothesis Tests for Variance H0 : 2 4 HA : 2 > 4 = 0.1 df = 19 Rejection region = 0.1 Dr. C. Ertuna
Next Lesson (Lesson - 04/D) Hypothesis Testing for 2 Samples Dr. C. Ertuna
Utilizing the Decision Method-I PHStat2 / Confidence Intervals / Estimate for the Mean, sigma unknown Accept H0 Reject H0 Dr. C. Ertuna
Utilizing the Decision Method-I Dr. C. Ertuna
Utilizing the Decision Method-III Dr. C. Ertuna
Utilizing the Decision Method-III p = (1-NORMSDIST(z))*(tails) p = TDIST(t, n-1, tails) Dr. C. Ertuna