Download
1 / 17
170 likes | 272 Views
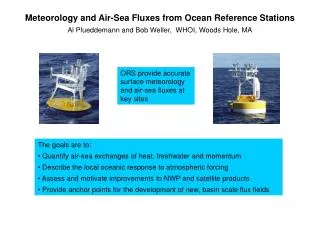
WAVES AND SEA-AIR FLUXES. CALM CONDITIONS.

E N D
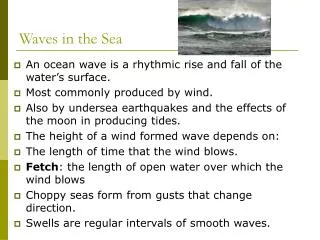
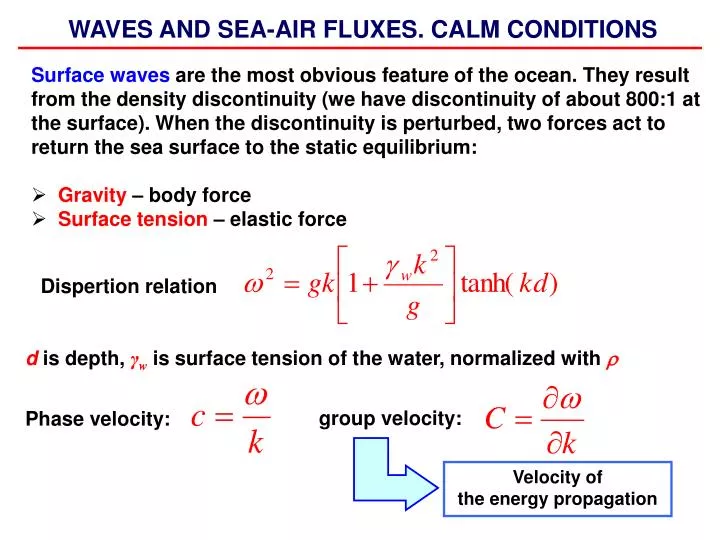
WAVES AND SEA-AIR FLUXES. CALM CONDITIONS • Surface waves are the most obvious feature of the ocean. They result from the density discontinuity (we have discontinuity of about 800:1 at the surface). When the discontinuity is perturbed, two forces act to return the sea surface to the static equilibrium: • Gravity – body force • Surface tension – elastic force Dispertion relation d is depth, γwis surface tension of the water, normalized with group velocity: Phase velocity: Velocity of the energy propagation
h - height p - period Main measures of surface wind waves: Basic measures: The zero-upcrossing period isthe time between two successive upcrossings of the mean level by surface elevation. The zero-upcrossing wave height isthe difference between the maximum and minimum values of the surface elevation between adjacent upcrossings of the mean level. The crest period isthe time between two successive crests. The crest-to-tough wave height isthe difference in height between a crest and the following tough. Statistical measure: Significant wave height is defined in terms of spectral moments as where m0 is the zeroth moment of the spectrum which is equal to the sea surface variance.
WAVES GROWTH AND PROPAGATION • Waves are generated by wind and have right after generation the phase velocities, smaller than wind has. They are short in wave length and small in amplitude. Their spectrum is represented by a smooth peak in the high frequency range. If wind acts for a certain time, waves start to propagate faster, become longer and higher. In general they tend to increase their speed up to the wind speed. When their speed achieves the values of the wind speed, they become no more dependent on wind and start to propagate as free waves. • Surface waves, traveling slower than wind (i.e. waves still under • the wind influence) are called wind sea (sea). • Wind sea traveling at wind speed is a fully developed sea. • Waves, traveling faster than wind are swell. Estimation of SWH from sea and swell heights: Swell height Sea height
Propagation measures Wave age: a = CP / Vef, whereCPis the deep water wave phase speed at spectral peak, derived from an estimate of the wave periodpw: CP = (g/2) pw, where gis the gravitational acceleration, andVefis component of the wind in the wave direction: Vef = V10 cos , where is the angle between wave and wind directions and V10is the wind speed at 10-m anemometer height and neutral stability. It is suggested, that for a < 1wave can be regarded as sea, while for a > 1, they should be considered as swell. Wave length: = CP pwwave slope: = h/
Water surface Actual wind vector near the water surface Mechanics of wind-wave interaction: normal stress induced by waves: Wind, not disturbed by waves Wind stream functions Normal stress Tangential stress Through the normal stress wind works “to push” waves ahead, providing: • Acceleration of wave motion • Transferring kinetic energy (17) If wind acts over a longer distance (fetch) or during a longer time (duration), waves tend to grow up, become longer and travel faster. Thus, wind stress over waves should be expressed as: Tangential stress Normal stress
How to parameterize the normal stress induced by waves? Key parameter: wave age Donelan (1982): Lake Ontario: where is rms wave height Smith (1991): Toba et al. (1990) : laboratory experiment : Alternative wave age – scaling with friction velocity. However, wind speed is a much easier available parameter, than u*. Estimates of a’ vary within the range from 4-5 (very young sea) to 30-40 (fully developed sea).
Geernaert et al. (1987): MARSEN experiment: Taylor and Yelland, 2001: consideration of the relationship between the wave height and wave length: where Hs is significant wave height, Ls is the peak wavelength. Summary of sea-state-dependent wind stress: • In general it should exist due to normal pressure components; • The effect ranges from nearly 0 to 30%, reasonable estimate is • of about 10%; • The role of swell is uncertain, up-to-date concern: no effect of swell.
Estimates of the effect of wave-induced stress: (Gulev and Hasse 1998, JPO) Smith 1988 Traditional estimate Smith 1991 Wave-age- based stress Ratio Sea-state dependent vs traditional JAN JUL Major effect: Midlatitudes, Winter season, Up to 20%
The other impacts of waves on sea-air exchange Surface albedo: There are two major mechanisms through which labedo can be affected by the wind waves: 1. Multiply scattering of the SW from the rough surface – generally should act to decrease albedo. The main role belongs to capillary waves and not to developed seas. Theoretical results of Presendorfer and Mobley (1986): • Albedo decreases with windspeed by • approximately 10-20% within the range • 0-20 m/s • Clear sky albedo decreases strongly than • that under the cloudy sky 2. However, this effect seems to be not the largest. Under strong storms foam patches work to increase albedo. Thus, the total effect is the slight increase of the albedo. Decreasing with surface roughness albedo has been observed only under small solar declinations and nearly complete cloud cover.
Observational results, based on 32000 direct measurements worldwide:
Impact of the wave breaking on evapration (non-turbulent mechanisms of the water transfer from the ocean to the atmosphere) Wave breaking results in the generation of foam, which is normally represented by the so-called white caps at sea surface. Moreover, wave breaking results into generation of water drops, spread in the surface atmospheric layer. These drops are characterized by different from the sea surface characteristics (temperature, heat capacity, surface tension). Thus, the conditions of evaporation of these drops are quite different from the evaporation from the surface. Normally, they evaporate easier. Which part of the sea surface is covered by the white caps:
Monahan et al (1982): Measurements based on photos W(%)=3.8410-6u3.4 Normally drops do not “jump” too high (10-15 cm)– their further evaporation depends on how long they “live” in the surface layer before they are dumping back. How do the drops behave? How long they are living in the surface layer? Lagrangian simulation of droplets at 12 cm height Wind is 5-12 m/s. Life time: up to 1 sec
Ce, Ct 1 V 15-20 m/s • How to account for what is going on with the droplet, • while it is flying in air? • Typical approach: modeling of the thermodynamics of droplets with field observations and laboratory experiments. • Architecture of a typical model (Bortkovsky 1982 “Sea-air exchange in storm conditions”): • System of equations of the droplet thermodynamics; • Derivation of the droplet coordinates (2D) at every step from the droplet size • and wind conditions; • Estimation of the droplet freshening and surface tension; • Estimation of the droplet temperature and heat capacity; • Estimation of the droplet size; • Computation of the heat and moisture loss by the droplet.
Calm conditions Paradox of bulk formulae: What happens if U=0, even if temperature and humidity gradients are quite high? =0 Q = 0 ???!!! Where we are with respect to the TKE? Production of TKE by buoyancy (+/-) (reversible) Mechanical production of TKE (normally positive) When u*approaches zero, the buoyancy flux does not! 0 These are the called “free convection conditions”, where the heat and mass transfer is fully driven by the buoyant production. This case can be easily studied in laboratory experiments.
Design of special experiment (Golitcyn and Grachov 1984) • Fully dark room 4x4x3 m; • Tank of water, d=30 cm, h=1m, • One open surface, the walls are inconductive for heat; • Temperature is measured at many levels; • Air temperature is measured; • The level of water is measured. Temperature parameter: Tw(0) – initial temperature, - scaling constant for time Field measurements under V<3 m/s is the thermal expansion of air, 0.61is the analog of humid contraction, is kinematic viscosity of air, gis gravitational acceleration, A=0.144, B=0.159are empirical constants.
Surface cool skin Under calm and low winds absorption of the solar radiation occurs on a larger scale (wave length) than sensible and latent heat transfer (molecular scale). This leads to the fact that very thin upper layer of the water is in a lesser degree affected by SW, but, nevertheless is cooled by sensible a latent heat. This is surface cold skin layer. Its temperature has to be taken for estimation of fluxes and not the bulk temperature. Hasse, 1971: experimental measurements in the surface layer during day time and night time – dependence of the SST “skin-bulk” deviation from heat flux and wind speed. Variations of empirical coefficients with the reference depth:
/helios/u2/gulev/handout: • gra.for - Golitcyn and Grachov free convection scheme (1984) • SST=10C, Ta=8C, ez=9mb, • SST=10C, Ta=12C, ez=11mb,