Download
1 / 1
30 likes | 301 Views
Meta-Analysis of g Loadings A ccording to the Cattell -Horn-Carroll Theory of Intelligence James Arnett and Randy G. Floyd The University of Memphis. Results. Background Information. Analyses.

E N D
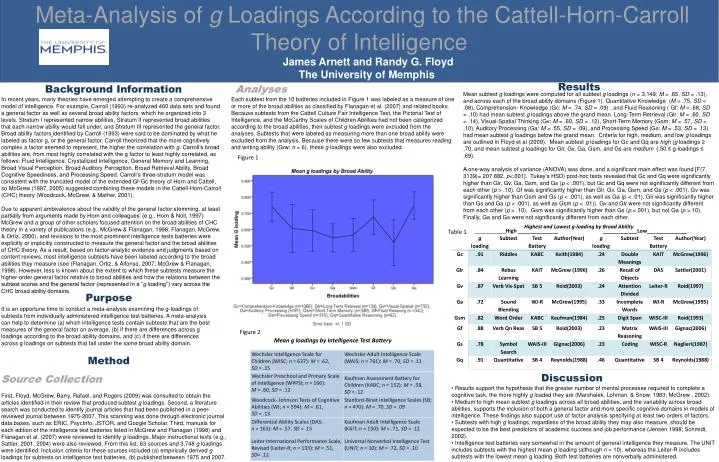
Meta-Analysis of g Loadings According to the Cattell-Horn-Carroll Theory of Intelligence James Arnett and Randy G. Floyd The University of Memphis Results Background Information Analyses Mean subtest g loadings were computed for all subtest g loadings (n = 3,149; M = .65, SD = .13), and across each of the broad ability domains (Figure 1). Quantitative Knowledge (M = .75, SD = .08), Comprehension- Knowledge (Gc: M = .74, SD = .09) , and Fluid Reasoning ( Gf: M = .68, SD = .10) had mean subtest g loadings above the grand mean. Long-Term Retrieval (Glr: M = .60, SD = .14), Visual-Spatial Thinking (Gv: M = .60, SD = .12), Short-Term Memory (Gsm: M = .57, SD = .10), Auditory Processing (Ga: M = .55, SD = .09), and Processing Speed (Gs: M = .53, SD = .13) had mean subtest g loadings below the grand mean. Criteria for high, medium, and low g loadings are outlined in Floyd et al (2009). Mean subtest g loadings for Gc and Gq are high (g loadings ≥ .70, and mean subtest g loadings for Glr, Gv, Ga, Gsm, and Gs are medium (.50 ≤ g-loadings ≤ .69). A one-way analysis of variance (ANOVA) was done, and a significant main effect was found [F(7, 3139)= 207.882, p<.001]. Tukey’s HSD) post-hoc tests revealed that Gc and Gq were significantly higher than Glr, Gv, Ga, Gsm, and Gs (p < .001), but Gc and Gq were not significantly different from each other (p > .10). Gf was significantly higher than Glr, Gv, Ga, Gsm, and Gs (p < .001). Gv was significantly higher than Gsm and Gs (p < .001), as well as Ga (p < .01). Glr was significantly higher than Gs and Ga (p < .001), as well as Gsm (p < .01)). Gv and Glr were not significantly different from each other (p > .10). Gsm was significantly higher than Gs (p <.001), but not Ga (p >.10). Finally, Ga and Gs were not significantly different from each other. In recent years, many theories have emerged attempting to create a comprehensive model of intelligence. For example, Carroll (1993) re-analyzed 460 data sets and found a general factor as well as several broad ability factors, which he organized into 3 levels. Stratum I represented narrow abilities, Stratum II represented broad abilities that each narrow ability would fall under, and Stratum III represented the general factor. Broad ability factorsidentified by Carroll (1993) were said to be dominated by what he labeled as factor g, or the general factor. Carroll theorized that the more cognitively complex a factor seemed to represent, the higher the correlation with g. Carroll’s broad abilities are, from most highly correlated with the g factor to least highly correlated, as follows: Fluid Intelligence, Crystallized Intelligence, General Memory and Learning, Broad Visual Perception, Broad Auditory Perception, Broad Retrieval Ability, Broad Cognitive Speediness, and Processing Speed. Carroll’s three-stratum model was consistent with the truncated model of the extended Gf-Gc theory of Horn and Cattell, so McGrew (1997, 2005) suggested combining these models in the Cattell-Horn-Carroll (CHC) theory (Woodcock, McGrew, & Mather, 2001). Due to apparent ambivalence about the validity of the general factor stemming, at least partially from arguments made by Horn and colleagues’ (e.g., Horn & Noll, 1997) McGrew and a group of other scholars focused attention on the broad abilities of CHC theory in a variety of publications (e.g., McGrew & Flanagan, 1998; Flanagan, McGrew, & Ortiz, 2000), and revisions to the most prominent intelligence tests batteries were explicitly or implicitly constructed to measure the general factor and the broad abilities of CHC theory. As a result, based on factor-analytic evidence and judgments based on content reviews, most intelligence subtests have been labeled according to the broad abilities they measure (see (Flanagan, Ortiz, & Alfonso, 2007; McGrew & Flanagan, 1998). However, less is known about the extent to which these subtests measure the higher-order general factor relative to broad abilities and how the relations between the subtest scores and the general factor (represented in a “g loading”) vary across the CHC broad ability domains. Each subtest from the 10 batteries included in Figure 1 was labeled as a measure of one or more of the broad abilities as classified by Flanagan et al. (2007) and related books. Because subtests from the Cattell Culture Fair Intelligence Test, the Pictorial Test of Intelligence, and the McCarthy Scales of Children Abilities had not been categorized according to the broad abilities, their subtest g loadings were excluded from the analyses. Subtests that were labeled as measuring more than one broad ability were excluded from the analysis. Because there were so few subtests that measures reading and writing ability (Grw; n = 6), these g loadings were also excluded. Figure 1 Highest and Lowest g-loading by Broad Ability ___________High ______________ ____________Low______________ Table 1 Purpose It is an opportune time to conduct a meta-analysis examining the g-loadings of subtests from individually administered intelligence test batteries. A meta-analysis can help to determine (a) which intelligence tests contain subtests that are the best measures of the general factor on average, (b) if there are differences across g loadings according to the broad ability domains, and (c) if there are differences across g loadings on subtests that fall under the same broad ability domain. Figure 2 Mean g loadings by Intelligence Test Battery Method Discussion Source Collection • Results support the hypothesis that the greater number of mental processes required to complete a cognitive task, the more highly g loaded they are (Marshalek, Lohman, & Snow, 1983; McGrew , 2002). • Medium to high mean subtest g loadings across all broad abilities, and the variability across broad abilities, supports the inclusion of both a general factor and more specific cognitive domains in models of intelligence. These findings also support use of factor analysis specifying at least two orders of factors. • Subtests with high g loadings, regardless of the broad ability they may also measure, should be expected to be the best predictors of academic success and job performance (Jensen 1998; Schmidt, 2002). • Intelligence test batteries vary somewhat in the amount of general intelligence they measure. The UNIT includes subtests with the highest mean g loading (although n = 10), whereas the Leiter-R includes subtests with the lowest mean g loading. Both test batteries are nonverbally administered. First, Floyd, McGrew, Barry, Rafael, and Rogers (2009) was consulted to obtain the articles identified in their review that produced subtest g loadings. Second, a literature search was conducted to identify journal articles that had been published in a peer-reviewed journal between 1975-2007. This scanning was done through electronic journal data bases, such as ERIC, PsycInfo, JSTOR, and Google Scholar. Third, manuals for each edition of the intelligence test batteries listed in McGrew and Flanagan (1998) and Flanagan et al. (2007) were reviewed to identify g loadings. Major instructional texts (e.g., Sattler, 2001, 2004) were also reviewed. From this list, 63 sources and 3,748 g loadings were identified. Inclusion criteria for these sources included (a) empirically derived g loadings for subtests on intelligence test batteries, (b) published between 1975 and 2007.