Download

1 / 84
930 likes | 1.45k Views
META-ANALYSIS OF RESEARCH. Texas A&M University SUMMER STATISTICS INSTITUTE June 2009 Victor L. Willson, Instructor. TOPIC AREAS. Background Research focus for meta-analysis Finding studies Coding studies Computing effect sizes Effect size distribution Mediators Moderators

E N D
META-ANALYSIS OF RESEARCH Texas A&M University SUMMER STATISTICS INSTITUTE June 2009 Victor L. Willson, Instructor
TOPIC AREAS • Background • Research focus for meta-analysis • Finding studies • Coding studies • Computing effect sizes • Effect size distribution • Mediators • Moderators • Report-writing • Current issues
Background • Purposes • Historical • Meta-analysis as survey research • Strengths • Weaknesses
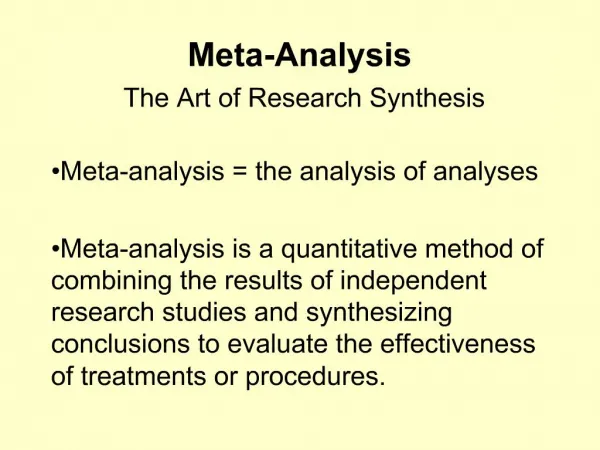
Purposes for Meta-Analysis • Cumulate findings of studies on a particular topic • Examine homogeneity of outcomes • Estimate effects of independent variables on outcomes in a standardized format • Evaluate moderator and mediator effects on outcomes • Differentiate different types or classes of outcome effects
Historical background • Criticism of traditional narrative reviews of research • Exasperation in social sciences with constructs measured different ways in terms of determining consistencies • Need to formulate theoretical relationships based on many studies
History part 2 • Early 1970s efforts focused on significance testing and “vote counts” of significance • Glass (1976) presented a method he called “meta-anlaysis” in Am. Ed. Research Assn. presidential address • Others proposed related methods, but Glass and colleagues developed the most widely used approach (Glass, McGaw, & Smith, 1981)
Meta-Analysis as Survey Research • Research articles as unit of focus • Population defined • Conditions for inclusion of articles • Data requirements needed for inclusion • Completeness of data available in article or estimable • Publication sources available, selected • Sample vs. population acquisition • Availability of publications and cost • Time to acquisition (how long to wait for retrieval)
Strengths of Meta-Analysis • Definition of effect and effect size beyond “significant or not” • Focus on selection threats in traditional reviews (bias in selection of articles for review) • Systematic consideration of potential mediators and moderators of effects • Data organization of articles for public review
Weaknesses of Meta-Analysis • Methodologically sophisticated and expensive • Potential ignoring of contextual effects not easily quantified; eg. historical/environmental placement of research • Potential improper mixing of studies • Averages hiding important subgroupings • Improperly weighting studies with different methodological strength/rigor
Research focus for meta-analysis • Defining and delineating the construct • Determining a research outlet • Meta-Analysis as an interactive, developing process
Recent Criticism • Suri & Clarke (2009): Advancements in Research Synthesis Methods: From a Methodologically Inclusive Perspective (Review of Educational Research, pp. 395-430) • They propose 6 overlapping approaches: • Statistical research syntheses (eg. meta-analysis) • Systematic reviews • Qualitative research syntheses • Qualitative syntheses of qualitative and quantitative research • Critical impetus in reviewing research • Exemplary syntheses
Some critical comments on Suri & Clarke (2009) • Systematic reviews- original Glass criticisms hold: what is the basis for inclusion and exclusion; why are certain articles privileged? • Qualitative research syntheses- how can these be done with situated contexts, small samples, environmentally-developed variables, sources, etc.? Will there be a review for every reader, or for every researcher? Same limitation as all qual research • Qual syntheses of quant and qual research- potentially doable, with an alternating order: qual first to focus emphases in the quant analysis, or quant first to be validated with the qual studies of particular environments and populations- do they fit/match in reasonable ways? • Critical impetus- code words for critical theory/Marxist etc. Answer is already known, why do the research? • Exemplary syntheses- what is the purpose?
Defining and Delineating the Research Topic • Outcome construct definition • Importance to the field to know what has been learned • How big is it? How many potential studies? • Conduct preliminary searches using various databases • Refining the construct • How much resource is available? Eg. 1000 studies = 2-3 years work • Are there specific sub-constructs more important than others? Select them or one of them • Are there time-limitations (no studies before 19xx) • Are there too few studies for the given construct, should it be broadened? Too few-> less than 10?
Defining and Delineating the Research Topic • What is the typical research approach for the topic area? • All quantitative • All qualitative • Mixed quantitative and qualitative • Are there sufficient quantitative studies to provide evidence for findings? • Can qualitative studies be included as a separate part of the study? How?
Determining Research Outlet • Does the proposed journal • publish research on the construct? • Publish reviews or meta-analyses? • Is there a journal devoted to reviews that your project would fit with? • Has a recent similar meta-analysis been published? If so, will yours add anything new? • Ex. Allen, et al (under review) evaluated articles on first grade retention after 1990 focusing on the quality of the research design in each study to determine if the effects were different from a fairly recent meta-analysis by Jimerson (2001)
Meta-Analysis as an interactive, developing process • View meta-analysis as evolutionary • As studies are reviewed and included, purpose and scope may change • Assume initial conceptualizations about both outcomes and potential predictors may change over time • Definitions, instruments, coding may all change as studies are found and included • Plan for revisions to all aspects of the meta-analysis
FINDING STUDIES • Searches • Selection criteria
Searches • Traditional literature review methods: • Current studies are cumulated Branching backward search uses the • Reference Lists of current studies • Electronic searches • Google, Google Scholar, PsyInfo, research library catalogs (for major research institution libraries) • Searches of major journal article titles and abstracts (commonly available now through electronic libraries) • Abstract vs. full content searches- electronic, pdf, hard copy • Author requests: email or hard copy requests for newly published articles or other works not found in typical search outcomes
Selection Criteria • In or out: • Any quantitative data available? • Descriptive data- means and SDs for all groups of interest? • Analysis summaries- F- or t-tests, ANOVA tables etc. available that may be utilized? • Iterative process: outs may come back in given broader definitions of a construct • Duplicated articles/data reports? Decide on which to keep (earliest? Most complete?) why were multiple articles prepared? New groups included that can be used? • Keep records of every study considered- excel or hard copy, for example
Selection Criteria • Useful procedure: • Create an index card for each study along with notes of each to refer to • Organize studies into categories or clusters • Review periodically as new studies are added, revise or regenerate categories and clusters • Consider why you organized the studies this way- does it reflect the scope of research, construct organization, or other classes?
CODING STUDIES • Dependent variable(s) • Construct(s) represented • Measure name and related characteristics • Effect size and associated calculations • Independent variables • Population • Sample • Design • Potential Mediators and Moderators • Bias mechanisms and threats to validity
CODING STUDIES- Dependent Variables • Construct name(s): eg. Receptive or Expressive Vocabulary • Measurement name: Willson EV Test • Raw score summary data (mean, SD for each group or summary statistics and standard errors for dep. var): Exp Mean= 22 Exp SD = 5 n=100, Con Mean = 19 Con SD = 4, n=100 • Effect size (mean difference or correlation) e = (22-19)/(20.5) • Effect size transformation used (if any) for mean differences: • t-test transform ( e = t (1/n1 + 1/n2)½ ), F-statistic transform (F)½ = t for df = 1, 198 • probability transform to t-statistic: t(198) = [probt(.02)] • point-biserial transform to t-statistic, regression coefficient t-statistic • Effect size transformations used (if any) for correlations: • t-statistic to correlation: r2 = t2 / (t2+ df) • Regression coefficient t-statistic to correlation
CODING STUDIES- Independent variables • Population(s): what is the intended population, what characterizes it? Gender? Ethnicity? Age? Physical characteristics, Social characteristics, Psychosocial characteristics? Cognitive characteristics? • Sample: population characteristics in Exp, Control samples eg. % female, % African-American, % Hispanic, mean IQ, median SES, etc.
CODING STUDIES- Independent variables Design (mean difference studies): • Random assignment, quasi-experimental, or nonrandom groups • Treatment conditions: treatment variables of importance (eg. duration, intensity, massed or distributed etc.); control conditions same • Treatment givers: experience and background characteristics: teachers, aides, parents • Environmental conditions (eg. classroom, after-school location, library)
CODING STUDIES- Independent variables Design (mean difference studies) 5. Time characteristics (when during the year, year of occurrence) 6. Internal validity threats: • maturation, • testing, • instrumentation, • regression, • history, • selection
CODING STUDIES- Independent variables Mediators and Moderators Mediators are indirect effects that explain part or all of the relationship between hypothesized treatment and effect: (T) e M In meta analysis we establish that the effect of T on the outcome is nonzero, then if M is significantly related to the effect e. We do not routinely test if T predicts M
CODING STUDIES- Independent variables Mediators and Moderators Moderators are variable for which the relationship changes from one moderator value to the next: (T) e for M=1 (T) e for M=2 .3 .7 In meta analysis we establish that the effect of T on the outcome is nonzero, then if M is significantly related to the effect e. We do not routinely test if T predicts M
Coding Studies- Bias Mechanisms • Researcher potential bias- membership in publishing cohort/group • Researcher orientation- theoretical stance or background • Type of publication: • Refereed vs. book chapter vs. dissertation vs. project report: do not assume refereed articles are necessarily superior in design or analysis- Mary Lee Smith’s study of gender bias in psychotherapy indicated publication bias against mixed gender research showing no effects by refereed journals with lower quality designs than non-refereed works • Year of publication- have changing definitions affected effects? Eg. Science interest vs. attitude- terms used interchangeably in 1940s-1950s; shift to attitude in 1960s • Journal of publication- do certain journals only accept particular methods, approaches, theoretical stances?
Computing Effect Sizes- Mean Difference Effects • Glass: e = (MeanExperimental – MeanControl)/SD • SD = Square Root (average of two variances) for randomized designs • SD = Control standard deviation when treatment might affect variation (causes statistical problems in estimation) • Hedges: Correct for sampling bias:g = e[ 1 – 3/(4N – 9) ] • where N=total # in experimental and control groups • Sg = [ (Ne + Nc)/NgNc + g2/(2(Ne + Nc) ]½
Computing Effect Sizes- Mean Difference Effects Example from Spencer ADHD Adult study • Glass: e = (MeanExperimental – MeanControl)/SD = (82 – 101)/21.55 = .8817 • Hedges: Correct for sampling bias:g = e[ 1 – 3/(4N – 9) ] = .8817 (1 – 3/(4*110 – 9) = .8762 Note: SD computed from t-statistic of 4.2 given in article: e = t*(1/NE + 1/NC )½
Computing Mean Difference Effect Sizes from Summary Statistics • t-statistic: e = t*(1/NE + 1/NC )½ • F(1,dferror): e = F½ *(1/NE + 1/NC )½ • Point-biserial correlation: e = r*(dfe/(1-r2 ))½ *(1/NE + 1/NC )½ • Chi Square (Pearson association): = 2/(2 + N) e = ½*(N/(1-))½ *(1/NE + 1/NC )½ • ANOVA results: Compute R2 = SSTreatment/Sstotal Treat R as a point biserial correlation
WORKING AN EXAMPLE Story Book Reading References 1 Wasik & Bond: Beyond the Pages of a Book: Interactive Book Reading and Language Development in Preschool Classrooms. J. Ed Psych 2001 2 Justice & Ezell. Use of Storybook Reading to Increase Print Awareness in At-Risk Children. Am J Speech-Language Path 2002 3 Coyne, Simmons, Kame’enui, & Stoolmiller. Teaching Vocabulary During Shared Storybook Readings: An Examination of Differential Effects. Exceptionality 2004 4 Fielding-Barnsley & Purdie. Early Intervention in the Home for Children at Risk of Reading Failure. Support for Learning 2003
Coding the Outcome 1 open Wasik & Bond pdf 2 open excel file “computing mean effects example” 3 in Wasik find Ne and Nc 4 decide on effect(s) to be used- three outcomes are reported: PPVT, receptive, and expressive vocabulary at classroom and student level: what is the unit to be focused on? Multilevel issue of student in classroom, too few classrooms for reasonable MLM estimation, classroom level is too small for good power- use student data
Coding the Outcome 5 Determine which reported data is usable: here the AM and PM data are not usable because we don’t have the breakdowns by teacher-classroom- only summary tests can be used 6 Data for PPVT were analyzed as a pre-post treatment design, approximating a covariance analysis; thus, the interaction is the only usable summary statistic, since it is the differential effect of treatment vs. control adjusting for pretest differences with a regression weight of 1 (ANCOVA with a restricted covariance weight): Interactionij= Grand Mean – Treat effect –pretest effect = Y… - ai.. – b.j. Graphically, the Difference of Gain inTreat(post-pre) and Gain in Control (post –pre) • F for the interaction was F(l,120) = 13.69, p < .001. • Convert this to an effect size using excel file Outcomes Computation • What do you get? (.6527)
Coding the Outcome Y Gain not “predicted” from control post gains pre Control Treatment
Coding the Outcome 7 For Expressive and Receptive Vocabulary, only the F-tests for Treatment-Control posttest results are given: Receptive: F(l, 120) = 76.61, p < .001 Expressive: F(l, 120) =128.43, p< .001 What are the effect sizes? Use Outcomes Computation 1.544 1.999
Getting a Study Effect • Should we average the outcomes to get a single study effect or • Keep the effects separate as different constructs to evaluate later (Expressive, Receptive) or • Average the PPVT and receptive outcome as a total receptive vocabulary effect? Comment- since each effect is based on the same sample size, the effects here can simply be averaged. If missing data had been involved, then we would need to use the weighted effect size equation, weighting the effects by their respective sample size within the study
Getting a Study Effect • For this example, let’s average the three effects to put into the Computing mean effects example excel file- note that since we do not have means and SDs, we can put MeanC=0, and MeanE as the effect size we calculated, put in the SDs as 1, and put in the correct sample sizes to get the Hedges g, etc. • (.6567 + 1.553 + 2.01)/3 = 1.4036
2 Justice & Ezell • Receptive: 0.403 • Expressive: 0.8606 • Average = 0.6303 • 4 Fielding • PPVT: -0.0764 3 Coyne et al • Taught Vocab: 0.9385 • Untaught Vocab: 0.3262 • Average = 0.6323
Computing mean effect size • Use e:\\Computing mean effects1.xls Mean
Computing Correlation Effect Sizes • Reported Pearson correlation- use that • Regression b-weight: use t-statistic reported, e = t*(1/NE + 1/NC )½ • t-statistics: r = [ t2 / (t2 + dferror) ] ½ Sums of Squares from ANOVA or ANCOVA: r = (R2partial) ½ R2partial = SSTreatment/Sstotal Note: Partial ANOVA or ANCOVA results should be noted as such and compared with unadjusted effects
Computing Correlation Effect Sizes • To compute correlation-based effects, you can use the excel program “Outcomes Computation correlations” • The next slide gives an example. • Emphasis is on disaggregating effects of unreliability and sample-based attenuation, and correcting sample-specific bias in correlation estimation • For more information, see Hunter and Schmidt (2004): Methods of Meta-Analysis. Sage. • Correlational meta-analyses have focused more on validity issues for particular tests vs. treatment or status effects using means
EFFECT SIZE DISTRIBUTION • Hypothesis: All effects come from the same distribution • What does this look like for studies with different sample sizes? • Funnel plot- originally used to detect bias, can show what the confidence interval around a given mean effect size looks like • Note: it is NOT smooth, since CI depends on both sample sizes AND the effect size magnitude
EFFECT SIZE DISTRIBUTION • Each mean effect SE can be computed from SE = 1/ (w) For our 4 effects: 1: 0.200525 2: 0.373633 3: 0.256502 4: 0.286355 These are used to construct a 95% confidence interval around each effect
EFFECT SIZE DISTRIBUTION- SE of Overall Mean • Overall mean effect SE can be computed from SE = 1/ (w) For our effect mean of 0.8054, SE = 0.1297 Thus, a 95% CI is approximately (.54, 1.07) The funnel plot can be constructed by constructing a SE for each sample size pair around the overall mean- this is how the figure below was constructed in SPSS, along with each article effect mean and its CI
EFFECT SIZE DISTRIBUTION- Statistical test • Hypothesis: All effects come from the same distribution: Q-test • Q is a chi-square statistic based on the variation of the effects around the mean effect Q = wi ( g – gmean)2 Q 2 (k-1) k