Download
1 / 11
110 likes | 123 Views
Pubrica has a broad experience in all aspects of Scientific Medical Writing, Editing, and Publishing. A global leader in comprehensive manuscript publication support service for academic and scientific journals, We provide a wide range of services that include Scientific medical research writing, Clinical data analysis, Literature review, Meta-analysis, medical Communication and medico-marketing solutions to healthcare/pharmaceutical/food and beverage companies.<br><br>Find freelance Meta-Analysis professionals, consultants, freelancers and get your project done - https://bit.ly/30V8QUK<br><br>Why Pubrica:<br>When you order our services, we promise you the following u2013 Plagiarism free, always on Time, outstanding customer support, written to Standard, Unlimited Revisions support and High-quality Subject Matter Experts.<br><br>Contact us:<br>Web: https://pubrica.com/<br>Blog: https://pubrica.com/academy/<br>Email: sales@pubrica.com<br>WhatsApp : 91 9884350006<br>United Kingdom : 44-1143520021<br>

E N D
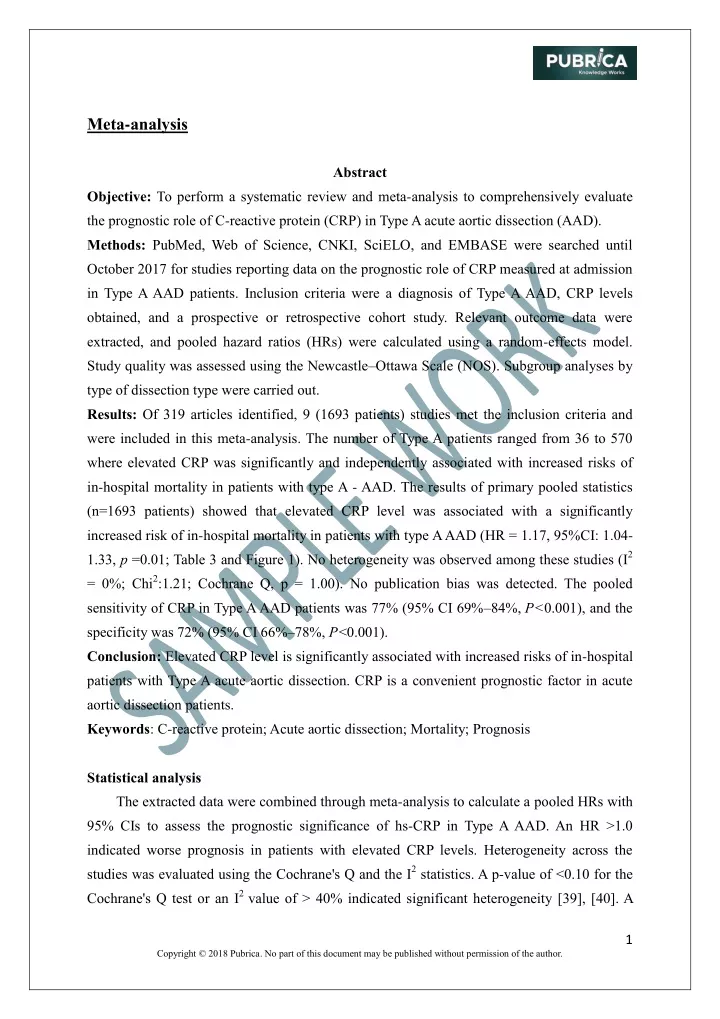
Meta-analysis Abstract Objective: To perform a systematic review and meta-analysis to comprehensively evaluate the prognostic role of C-reactive protein (CRP) in Type A acute aortic dissection (AAD). Methods: PubMed, Web of Science, CNKI, SciELO, and EMBASE were searched until October 2017 for studies reporting data on the prognostic role of CRP measured at admission in Type A AAD patients. Inclusion criteria were a diagnosis of Type A AAD, CRP levels obtained, and a prospective or retrospective cohort study. Relevant outcome data were extracted, and pooled hazard ratios (HRs) were calculated using a random-effects model. Study quality was assessed using the Newcastle–Ottawa Scale (NOS). Subgroup analyses by type of dissection type were carried out. Results: Of 319 articles identified, 9 (1693 patients) studies met the inclusion criteria and were included in this meta-analysis. The number of Type A patients ranged from 36 to 570 where elevated CRP was significantly and independently associated with increased risks of in-hospital mortality in patients with type A - AAD. The results of primary pooled statistics (n=1693 patients) showed that elevated CRP level was associated with a significantly increased risk of in-hospital mortality in patients with type A AAD (HR = 1.17, 95%CI: 1.04- 1.33, p =0.01; Table 3 and Figure 1). No heterogeneity was observed among these studies (I2 = 0%; Chi2:1.21; Cochrane Q, p = 1.00). No publication bias was detected. The pooled sensitivity of CRP in Type A AAD patients was 77% (95% CI 69%–84%,P < 0.001), and the specificity was 72% (95% CI 66%–78%,P <0.001). Conclusion: Elevated CRP level is significantly associated with increased risks of in-hospital patients with Type A acute aortic dissection. CRP is a convenient prognostic factor in acute aortic dissection patients. Keywords: C-reactive protein; Acute aortic dissection; Mortality; Prognosis Statistical analysis The extracted data were combined through meta-analysis to calculate a pooled HRs with 95% CIs to assess the prognostic significance of hs-CRP in Type A AAD. An HR >1.0 indicated worse prognosis in patients with elevated CRP levels. Heterogeneity across the studies was evaluated using the Cochrane's Q and the I2 statistics. A p-value of <0.10 for the Cochrane's Q test or an I2 value of > 40% indicated significant heterogeneity [39], [40]. A 1 Copyright © 2018 Pubrica. No part of this document may be published without permission of the author.
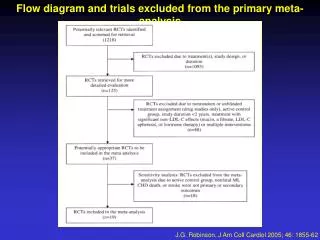
random-effects model was used when significant heterogeneity was present [41]; otherwise, a fixed-effects model was used [40]. Subgroup analyses were conducted by data type, types of AAD, and adjusted status of HRs. Funnel plot and the Egger’s test were used to evaluate the risk of publication bias. Stata version 12.0 (STATA Corporation, College Station, TX, USA) was used for all statistical analyses. A two-sided p value of < 0.05 was considered statistically significant. Results Study selection A total of 319 potentially eligible studies were identified through the search of the electronic databases (Figure 1). After reviewing the titles and abstracts, 270 studies were excluded, and 24 studies were retained for a further detailed evaluation [16]–[19], [27], [28], [30]–[33], [42]–[54]. Based on the inclusion and exclusion criteria, 16 studies were excluded [16]–[19], [31], [32], [49]–[54]. Thus, 9 studies, with a total of patients with Type A acute aortic dissection, were included in this meta-analysis [27]–[30], [33], [43]–[48], [55]. Characteristics of included studies Table 1 presents the characteristics of the included studies. All nine studies were published between 2002 to 2017, and the number of patients ranged from 36 to 570. In the studies, the numbers of patients in the deceased group ranged from 5 to 94 (total = 360), and the number of patients in the survival group ranged from 31 to 509 (total = 1301). Out of nine studies, six studies [46]–[48], had NOS score over 6 points while the other three studies [42], [43], [45] met five points. All included studies were retrospective cohort studies that examined the CRP level at admission and assessed the prognostic role of at-admission CRP in Type A AAD patients. Seven studies were performed in China, one in Austria and one in Croatia. The sample sizes of the studies ranged from 36 to 570, with most studies having enrolled more than 100 patients. All eight studies reported data on in-hospital mortality [43], [45], [47], [48]. Eight studies reported unadjusted risk estimates, while five studies only reported unadjusted risk estimates. CRP values in two [27], [45] study was dealt as a binary variable, with different cut-off values while six studies presented CRP as continuous variable [32], [42], [43], [45], [47] (Table 1). Primary Outcome The results of primary pooled statistics (n=1693 patients) showed that elevated CRP level was associated with a significantly increased risk of in-hospital mortality in patients with type A AAD (HR = 1.17, 95%CI: 1.04-1.33, p =0.01; Table 3 and Figure 1). No heterogeneity was observed among these studies (I2 = 0%; Chi2:1.21; Cochrane Q, p = 1.00). 2 Copyright © 2018 Pubrica. No part of this document may be published without permission of the author.
Only eight studies (n = 1442 patients) reported univariate adjusted HRs on the association between CRP level and in-hospital mortality. Elevated CRP level was associated with a significantly increased risk of in-hospital mortality in patients with type A acute aortic dissection (HR =1.27, 95%CI: 1.12-1.45, p =0.0003; Table 4 and Figure 2). No heterogeneity was observed among these studies (I2 = 0%; 95% Chi2: 2.30; Cochrane Q, p = 0.94). Sensitivity and Specificity of CRP in predicting inhospital mortality All 4 studies provided complete sensitivity and specificity data, and were included in the analysis. Forest plots summarizing the sensitivity and specificity of CRP levels are shown in Table 5 and Figure 3, respectively. A random-effects analysis was applied because there was evidence of heterogeneity among the studies (sensitivity: Heterogeneity chi-squared = 29.54,I2 = 89.8%,P < 0.001; Table 5 and Figure 3) and (specificity: Heterogeneity chi-squared = 34.29, I2 = 91.3%,P < 0.001; Table 6 and Figure 4). The pooled sensitivity of CRP in Type A AAD patients was 77% (95% CI 69%–84%,P < 0.001), and the specificity was 72% (95% CI 66%–78%,P <0.001). CRP levels were used as continuous variable, and different cut off in each study but all four studies did have minimum CRP cut off value of ≥9.5, which had sensitivity 77% and specificity was 72% to predict in-hospital mortality among Type A patients. Subgroup Analyses The results of subgroup analyses were conducted separately for the studies that had CRP as a continuous and categorical variable. The six studies [32], [42], [43], [45], [47], [48] had used CRP as continuous variable where elevated CRP level (n=1151 patients) was significantly associated with an increased risk of in-hospital mortality in patients with type A AAD (HR = 1.18, 95%CI: 1.02-1.37, p =0.03; Table 7 and Figure 5). No heterogeneity was observed among these studies (I2 = 0%; Chi2: 0.57; Cochrane Q, p = 0.99). Two studies [27], [45] [elevated >6.3 mg/L and ≥12.05 mg/L (categorical)] CRP level as categorical variable (n=291 patients). However, CRP was not associated with increased risk of in-hospital mortality in patients with type A AAD (HR = 1.22, 95%CI: 0.93-1.61, p =0.14; Table 8 and Figure 6). No heterogeneity was observed among these studies (I2 = 0%; Chi2=0.24; Cochrane Q, p = 0.63). Publication bias To evaluate the risk of publication bias, a funnel plot and Egger’s test was employed. No obvious publication bias was observed in this meta-analysis in case of association between high CRP level and in-hospital mortality (p value of eggers?). 3 Copyright © 2018 Pubrica. No part of this document may be published without permission of the author.
Table 1 Characteristics of all studies included in the meta-analysis Study*Ref.+CountryDesign Participants Outcome (Data type) In-hospital mortality (H vs L) In-hospital mortality (per unit) Age(y) Men n(%) 69(70.4) CRP level 14.7 (10.5,21.6) VS 5.9 (2.6,10.3) 9.8±7.8 VS 14.3±10.1 AdjustmentNOS score 6 Yes China Retrospective98 patients with acute type A aortic dissection Retrospective103 patients with type-A acute6767 aortic dissection Retrospective212 consecutive patients with type A acute aortic dissection 55.9±10.3 VS 50.8±9.2 Zhou et al. [48] China 71(68.9) Yes Li et al. [47] 56.5±13.8 VS 53.3±13.2 47.7±11.6 VS 51.2±10.7 6 China In-hospital mortality (per unit); Long-term mortality after a median follow-up of 8.8 months (per unit) Long-term mortality after a median follow-up of 1.89 years (per unit) In-hospital mortality (H vs L) 161(75.9)30.9 (6.5-85.1) VS 74.2(8.6- 132.0) No 5 Huang et al. [43] China Retrospective570 consecutive patients with type A aortic dissection 429(75.3)60.0(56.3- No 5 Fan et al. [42] 46.7±12.7 VS 46.9±10.9 69.0) VS 52.0 (31.6- 60.9) China Retrospective114 patients with acute aortic dissection Retrospective36 patients with acute type A acute aortic dissection Retrospective255 patients with acute aortic disease Wen et al. [46] 48.9±7.6 VS 48.6±7.6 96(84.2) 11.18±1.85 VS 14.08±2.81 Yes 6 China In-hospital mortality (H vs L) Wen et al. [45] 50.6±10.4 VS 67.4±2.3 30(83.3) 11.81±1.87 VS 15.67±5.04 Yes 5 Austria Long-term mortality after a median follow-up of 50 months (H vs Median: 66 VS 72 179(70.2)<0.5 to >6.30 in Quartiles Schillinger et al. [27] Yes 7 4 Copyright © 2018 Pubrica. No part of this document may be published without permission of the author.
Study*Ref.+CountryDesign Participants Outcome (Data type) L) CRP has independent prognostic value in type A AAD and the addition of CRP to IRAD score improved discriminative capacity of in- hospital mortality irrespective of symptom duration and treatment strategy. PCT levels measured in patients undergoing Type A aortic dissection (TAAD) were used to determine prognostic values for complications and surgical outcomes Age(y) Men n(%) CRP level AdjustmentNOS score Croatia Retrospective54 patients with Type A Vrsalovic et al. [32] 62±12 VS 77±13 34(63.0) 5.0 (2.5-8.5) VS 15.7 (10.8- 21.4) No 6 China Retrospective251 patients with Type A 197(78.5)92.82±57.29 VS 128.10±156.80 No Liu et al [55]. 48.94±12.85 VS 49.67±12.87 6 (NOS, Newcastle-Ottawa Scale; H vs L, high CRP level versus low CRP level; Mean±SD 5 Copyright © 2018 Pubrica. No part of this document may be published without permission of the author.
Table 2 C-reactive protein Outcomes of the Included Studies Studies (Publication year) Number of Patients CRP Cutoff Value, (mg/L) ≥9.5 14 na na 11.21 na >9.8 na na Sensitivity (%) Specificity (%) PPV (%) NPV (%) AUC Zhou et al. [48] Li et al. [47] Huang et al. [43] Fan et al. [42] Wen et al. [46] Wen et al. [45] Vrsalovic et al. [32] Schillinger et al. [27] Liu et al.[55] 32 36 50 61 31 5 24 94 27 80 48.9 na na 100 na 83 na na 69 94.3 na na 54.2 na 80 na na 56.5 81.8 na na 44.9 na 76.9 na na 88.5 77.8 na na 100 na 85.7 na na 0.69 0.70 na na 0.822 na 0.79 na na 6 Copyright © 2018 Pubrica. No part of this document may be published without permission of the author.
Table 3 Forest plot for CRP levels between Death and Survival (overall, Univariate and Multivariate) Figure 1 Funnel plot for CRP levels between Death and Survival 7 Copyright © 2018 Pubrica. No part of this document may be published without permission of the author.
Table 4 Forest plot for CRP levels in univariate Cox regression between Death and Survival Figure 2 Funnel plot for CRP levels in univariate Cox regression between Death and Survival 8 Copyright © 2018 Pubrica. No part of this document may be published without permission of the author.
Table 5 Sensitivity for C reactive protein levels [95% Interval.] 0.636-0.928 0.329-0.671 0.888-1.000 0.626-0.953 0.688-0.843 Conf. Study Sensitivity TP/(TP+FN) TN/(TN+FP) Zhou 2016 Li G 2016 Wen D 2013 Vrsalovic 2015 Pooled Sensitivity Heterogeneity chi-squared = 29.54 (d.f.= 3) p = 0.000 Inconsistency (I-square) = 89.8 % No. studies = 4. Figure 3 Forest plot evaluating the sensitivity for C reactive protein levels 0.813 0.500 1.000 0.833 0.772 26/32 18/36 31/31 20/24 46/66 63/67 45/83 24/30 Table 6 Specificity for C reactive protein levels [95% Interval.] 0.571-0.804 0.854-0.983 0.429-0.652 0.614-0.923 0.663-0.778 Conf. Study Specificity TP/(TP+FN) TN/(TN+FP) Zhou 2016 Li G 2016 Wen D 2013 Vrsalovic 2015 Pooled Sensitivity Heterogeneity chi-squared = 34.29 (d.f.= 3) p = 0.000 Inconsistency (I-square) = 91.3 % No. studies = 4. 0.697 0.940 0.542 0.800 0.724 26/32 18/36 31/31 20/24 46/66 63/67 45/83 24/30 9 Copyright © 2018 Pubrica. No part of this document may be published without permission of the author.
Figure 4 Forest plot evaluating the specificity for C reactive protein levels Table 7 Forest plot for Subgroup CRP levels (Continuous) between Death and Survival Figure 5 Funnel plot for Subgroup CRP levels (Continuous) between Death and Survival 10 Copyright © 2018 Pubrica. No part of this document may be published without permission of the author.
Table 8 Forest plot for Subgroup CRP levels (Categorical) between Death and Survival Figure 6 Funnel plot for Subgroup CRP levels (Categorical) between Death and Survival End of the Sample Work See other sample in www.pubrica.com Contact Us 11 Copyright © 2018 Pubrica. No part of this document may be published without permission of the author.