Download
1 / 24
250 likes | 407 Views
Modelling of the 2005 flood event in Carlisle . Jeff Neal 1 , Paul Bates 1 , Tim Fewtrell , Matt Horritt , Nigel Wright, Ignacio Villanuaver , Sylvia Tunstall , Hazel Faulkner, Tom Coulthard , Jorge Ramirez, Caroline Keef 2 , Keith Beven and David Leedal 3.

E N D
Modelling of the 2005 flood event in Carlisle Jeff Neal1, Paul Bates1, Tim Fewtrell, Matt Horritt, Nigel Wright, Ignacio Villanuaver, Sylvia Tunstall, Hazel Faulkner, Tom Coulthard, Jorge Ramirez, Caroline Keef2, Keith Bevenand David Leedal3 1School of Geographical Sciences, University Road, University of Bristol, Bristol. BS8 1SS. 2JBA Consulting, South Barn, Broughton Hall, Skipton, N Yorkshire, BD23 3AE, UK. 3Lancaster Environment Centre, Lancaster University, Lancaster, LA1 4YQ, UK.
Introduction • Carlisle 2005 event data • Overview • Issues • Inundation modelling • Channel hydraulics and gauges • Structural complexity • Resolution • New numerical scheme • Beyond inundation modelling • Urban futures • Probabilistic flood risk at confluences
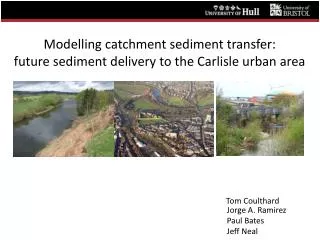
Urban floodplain processes 25 m resolution 10 m resolution 5 m resolution Neal et al., 2009
i j • A new LISFLOOD-FP formulation • Continuity Equation • Continuity equation relating flow fluxes and change in cell depth • Momentum Equation • Flow between two cells is • calculated using: • Manning’s equation (ATS) hflow j i Representation of flow between cells in LISFLOOD-FP
The problem at confluences Q RP ? ? Q Q RP RP
The problem at confluences • Model the conditional distribution of a set of variables given that one of these variables exceeds a high threshold. Event simulation with spatial dependence
The problem at confluences (uncertainty) • Model the conditional distribution of a set of variables given that one of these variables exceeds a high threshold. Refit to data and run event generator may times to approximate uncertainty
Hydraulic modelling • LISFLOOD-FP hydraulic model (Bates et al., 2010) • 1D diffusive channel model • 2D floodplain model at 10 m resolution • Model calibrated on 2005 flood event (RMSE 0.25 m).
Hydraulic modelling • LISFLOOD-FP hydraulic model (Bates et al., 2010) • 1D diffusive channel model • 2D floodplain model at 10 m resolution • Model calibrated on 2005 flood event (RMSE 0.25 m). • Event simulation • 47000 events • Scaled 2005 hydrographs • Event simulation time was 0.1-2 hours • Analysis took 5 days and generated 40 GB of data
Run 1 flood frequency • Run 1 of the event generator using all flow data
Run 1 flood frequency • The maximum flood outline was a combination of multiple events. • Cannot assume same return period on all tributaries
Risk • MasterMap building outlines • Depth damage curve • Calculate damage from each event
Conclusions • Flooding at confluences is critical to the basin-wide development of flood hazard and depends on the joint spatial distribution of flows. • Assuming steady state flows over predicted flood hazard for a range of flows and event durations. • The maximum flood outline was a combination of multiple events. • Cannot assume the same return period on all tributaries • Risk assessment using the event data was demonstrated. • Expected damages increase nonlinearly. • As expected a few events caused most of the damage.