Download
1 / 29
320 likes | 412 Views
Fourier Analysis. 15-463: Rendering and Image Processing Alexei Efros. Image Scaling. This image is too big to fit on the screen. How can we reduce it? How to generate a half- sized version?. Image sub-sampling. 1/8. 1/4.

E N D
Fourier Analysis 15-463: Rendering and Image Processing Alexei Efros
Image Scaling This image is too big to fit on the screen. How can we reduce it? How to generate a half- sized version?
Image sub-sampling 1/8 1/4 • Throw away every other row and column to create a 1/2 size image • - called image sub-sampling Slide by Steve Seitz
Image sub-sampling 1/2 1/4 (2x zoom) 1/8 (4x zoom) Why does this look so crufty? Slide by Steve Seitz
Even worse for synthetic images Slide by Steve Seitz
Really bad in video Slide by Paul Heckbert
Input signal: Matlab output: WHY? x = 0:.05:5; imagesc(sin((2.^x).*x)) Aj-aj-aj: Alias! Not enough samples Alias: n., an assumed name Picket fence receding Into the distance will produce aliasing…
Aliasing • occurs when your sampling rate is not high enough to capture the amount of detail in your image • Can give you the wrong signal/image—an alias • Where can it happen in graphics? • During image synthesis: • sampling continous singal into discrete signal • e.g. ray tracing, line drawing, function plotting, etc. • During image processing: • resampling discrete signal at a different rate • e.g. Image warping, zooming in, zooming out, etc. • To do sampling right, need to understand the structure of your signal/image • Enter Monsieur Fourier…
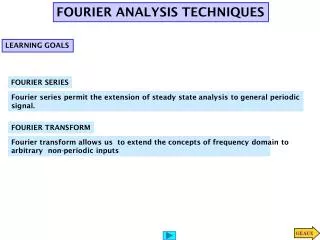
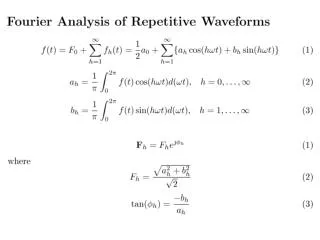
Jean Baptiste Fourier (1768-1830) • had crazy idea (1807): • Any periodic function can be rewritten as a weighted sum of sines and cosines of different frequencies. • Don’t believe it? • Neither did Lagrange, Laplace, Poisson and other big wigs • Not translated into English until 1878! • But it’s true! • called Fourier Series
A sum of sines • Our building block: • Add enough of them to get any signal f(x) you want! • How many degrees of freedom? • What does each control? • Which one encodes the coarse vs. fine structure of the signal?
Inverse Fourier Transform Fourier Transform F(w) f(x) F(w) f(x) Fourier Transform • We want to understand the frequency w of our signal. So, let’s reparametrize the signal by w instead of x: • For every w from 0 to inf, F(w) holds the amplitude A and phase f of the corresponding sine • How can F hold both? Complex number trick! We can always go back:
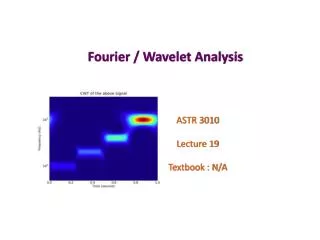
Frequency Spectra • Usually, amplitude is more interesting than phase:
FT: Just a change of basis M * f(x) = F(w) = * . . .
IFT: Just a change of basis M-1 * F(w)= f(x) = * . . .
Finally: Scary Math • …not really scary: • is hiding our old friend: • So it’s just our signal f(x) times sine at frequency w phase can be encoded by sin/cos pair
Extension to 2D in Matlab, check out: imagesc(log(abs(fftshift(fft2(im)))));
Curious things about FT on images • The magnitude spectra of all natural images quite similar • Heavy on low-frequencies, falling off in high frequences • Will any image be like that, or is it a property of the world we live in? • Most information in the image is carried in the phase, not the amplitude • Seems to be a fact of life • Not quite clear why
Important facts The Fourier transform is linear There is an inverse FT if you scale the function’s argument, then the transform’s argument scales the other way. This makes sense --- if you multiply a function’s argument by a number that is larger than one, you are stretching the function, so that high frequencies go to low frequencies The FT of a Gaussian is a Gaussian. The convolution theorem The Fourier transform of the convolution of two functions is the product of their Fourier transforms The inverse Fourier transform of the product of two Fourier transforms is the convolution of the two inverse Fourier transforms Various Fourier Transform Pairs Slide by David Forsyth
2D convolution theorem example |F(sx,sy)| f(x,y) * h(x,y) |H(sx,sy)| g(x,y) |G(sx,sy)| Slide by Steve Seitz
Low-pass, Band-pass, High-pass filters low-pass: band-pass: what’s high-pass?