Download
1 / 24
240 likes | 379 Views
A Predictive Study of Use Impacts on the Denali Park Road. Ted Morris 1 John Hourdos, Ph.D. 1 Prof. Max Donath, Ph.D. 2. 1 Minnesota Traffic Observatory, Dept of Civil Engineering, U of Minnesota. 2 Intelligent Transportation Systems Institute, U of Minnesota. Background.

E N D
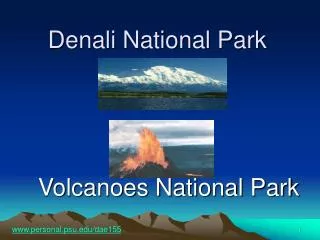
A Predictive Study of Use Impacts on the Denali Park Road Ted Morris1 John Hourdos, Ph.D.1 Prof. Max Donath, Ph.D.2 1 Minnesota Traffic Observatory, Dept of Civil Engineering, U of Minnesota 2 Intelligent Transportation Systems Institute, U of Minnesota
Background • General Management Plan authorized limit of 10,512 vehicle trips annually on park road in 1986. Restricted to mostly buses since 1972. • Limit based on 1984 use levels allowing a 20% increase in buses and 45% decrease in private vehicles. Limit NOT based on research. • Current pressure to increase access to Denali Park from various interest groups. • NPS designed this study to determine carrying capacity of park road to be able to define and explore limits set on traffic.
The Road • ~90 miles, restricted gravel road • Variable lane width, 2 at beginning, 1 and 1.5 further in • Unparalleled wildlife viewing • Only road access to interior park wilderness and campsites
Previous Studies • Tracy 1977 – first traffic/wildlife study; observations from bus; noted negative reactions from some wildlife <100 m from road • Singer and Beattie 1986 – study compared results to Tracy. Saw decrease in # of bears and caribou near road. Observations of disturbance to wildlife especially close to road and during periods of increased traffic (road lottery). • Putera and Keay 1996 – focused on migration of Dall sheep across road. Sheep seem to be very sensitive to traffic during migration. Suggested numerous traffic behavior “rules” to decrease disturbance.
Previous Studies… • Taylor et al. 1997 – used observations from 15 bus drivers over 4 years to develop monitoring protocol; # of moose and wolves showed a negative relationship with numbers of private vehicles. • Yost 1998 – examined wildlife densities within “viewsheds”; moose perhaps avoided areas <200m of road. • Burson et al. 2000 – compared their observations to those of all previous wildlife/traffic studies; moose declined by 50% but estimated overall population also declined; did not detect any significant impacts of increased road traffic in distribution or abundance of wildlife
Previous Studies: Limitations • Generally results of previous studies suggestive of negative effects on visitor experience and wildlife but inconclusive: • Habituation of animals observed • Observation based studies • Little known about wildlife use of areas away from road • Limited ability to determine difference between general population declines and avoidance of road • Lack consideration of logistical constraints of traffic on park road (scheduling constraints, driver and traffic behaviors, road travel time)
Study Design: potential for 3 phases • Park Road Capacity Study (2006-2008) • Develop simulation model in order to determine whether road is currently at, under, or over *capacity • The term capacity refers to social (and biological) capacity • If model indicate road use is under capacity, conduct EIS to establish alternatives for increased road use (2007-2008) • Any increased traffic would be implemented over numerous years and alternate time periods • Select a feasible set of alternative traffic management strategies guided by simulation model results • A Before-After-Control-Impact (BACI) study would be implemented to evaluate effects of EXPERIMENTAL traffic increase (2008-2010) • May include studies on traffic flow, animal movements, wildlife sightings, dust, noise, visitor experience, bird densities
Study Design: three Interrelated Components • Road Traffic Model: Predict traffic patterns based on driving behaviors and other logistics and road constraints • Road Capacity Model: Identify indicators of a visitor’s quality of experience of road trip and related activities • Wildlife movement Model: Factor effects of daily traffic volumes on Bear and Dall Sheep species locations
WildlifeMovment • 20 grizzly bears captured and fitted with GPS collars in Spring 2006 (one location point/hr) • Collars retrieved on Sept 20 2006 to download data • Spatial analysis performed this winter for movement model, factoring effects of recorded daily road traffic volumes • Cooperators: Rick Mace, Montana Department of Fish, Wildlife and Parks
Road Capacity Study: Visitors 2006 • 120 qualitative visitor surveys conducted this summer about visitor experience on the park road • “Can you describe the role that the Denali Park Road plays in your visit to the park?” • “How does the number of vehicles on the Denali Park Road affect your enjoyment of visiting the park?” ….. • Qualitative visitor surveys will be analyzed for indicators of quality of experience which will then be used to create quantitative survey for 2007 season • Cooperators: Robert Manning and Jeff Hallo, University of Vermont
Traffic Microsimulation Rationale • Earlier studies have explored the reactions of wildlife to increased vehicle volumes- mainly directed to understanding the impact of rural highway traffic • In the case of Denali, the traffic patterns are as unique as the park itself (Complex traffic ‘rules’ & logistics, terrain and road geometry) • Facilitate quantitative + visual analysis of predicted queue formations (e.g., ‘bunching’), travel times, and following distances between buses and other vehicles along the road
Traffic Model Simulation Process *Microsimulation execution Bus scheduling &Other vehicle Traffic (GPS) Result models For each time step: Predicted Traffic flow: Bus queuing time # of stops, trip times, Vehicle-vehicle Encounters Vehicle-Vehicle Interactions & Traffic rules Vehicle/driver dynamics Wildlife Encounters • Traffic Logistics • Events Park Road Geometry Wildlife Encounter Events *Stochastic-run many exp
At-Capacity Mitigate Monitor Prepare EIS, Select Alternative Traffic Model Simulation Process Calculate VQE Indicators. Indicator model derived from 2007 Social Surveys Predicted Traffic flow: Bus queuing time # of stops, trip times, Vehicle-vehicle Encounters Over-Capacity Under Capacity
Simulation Scenarios Microsimulation execution Propose bus Schedules - minimize impact on wildlife Propose changes in logistical rules. Example: increase/decrease amount of time to stop and view wildlife, rest stops
Traffic Speed Characteristics (GPS) Bus position and speed data between 6/19/06 and 6/25/06 for 3 miles of the 95 mile road. 85 buses and 33 NPS vehicles equipped in 2006, 150 buses in 2007.
Stopping Reasons/Wildlife Encounters • Touch panel data loggers on buses allow drivers to categorize, timestamp, and geo-locate reasons for stopping. 13 buses equipped by tail end of 2006 season. Stopping reasons Species type Relative species loc. Passenger stop pick-up/drop-off
Logistics, Wildlife Encounter Rules Vehicle/Bus yieldbehavior For each time step Advance position of each vehicle based on: Traffic rules Route paths and schedules Vehicle-vehicle interactions (right figs) Wildlife encounter ‘creates’ road incident at location x, time t, duration Dt. Bus arrives at x, within t, t+ Dt? yes no Time length of stop, Twe. Vehicle Stops
Traffic Model Study: 2007 • Calibrate simulation for speed variation: • Tour Bus types (VTS, TWT, NHT…) and other vehicles • Weather – precipitation, visibility • Direction of travel • Road location • Compare 2006 & 2007 seasonal data
Traffic Model Study: 2007 • Wildlife encounter and other stop behaviors • Species type • Species distance from road • Effects from previous encounters • Bus tour type • Other traffic logistics
Traffic Model Limitations • Possible dynamic ‘feedback’ mechanisms between wildlife movement and traffic characteristics not considered • Limited data loggers (20 equipped for 2007) affect characterization of all stopping reasons and associated driver behaviors & wildlife encounters • Sampling frequency of events low (20/150 buses) • Driver acceptance/usage habits • Bus not in service
Road Capacity Study: 2007 • Capture 20 Dall sheep and fit with GPS collars, wildlife observations • Continue to collect traffic information with GPS (hand-held for government vehicles), touch screen panels, traffic counters, “quiet night” • Conduct quantitative visitor survey • Complete final road capacity model and determine whether park road can accommodate more traffic
Acknowledgements • Project sponsor and data management: Phillip Hooge (Asst. Superintendent, project lead ), Tom Meier, Pat Owen, Laura Phillips, Amanda Peacock, John Paynter Denali Park, National Park Servicehttp://www.nps.gov/dena/parkmgmt/upload/RoadCapacityFactSheetFinal.pdf • Road Capacity model development: Robert Manning, Jeffrey Hallo, Park Studies Laboratory, Rubenstein School of Environment And Natural Resources, University of Vermonthttp://www.uvm.edu/envnr/parkstudies • Bear and sheep movement: Rick Mace, Montana Fish & Wildlife http://fwp.mt.gov/wildthings/tande/monitoring.html , e-mail: rmace@mt.gov • Bus GIS/GPS instrumentation and systems integration: Brian Hewitt, Bill Ward, Matt Gerber, Dominic Canale, Doyon/Aramarkhttp://www.reservedenali.com/