Download
1 / 36
360 likes | 473 Views
Karim Belhadjali – Coastal Protection and Restoration Authority. Louisiana’s Comprehensive Master Plan for a Sustainable Coast: 2012 Update. Builds on Other Efforts. Linking Back to Master Plan Objectives. Reduce economic losses from storm-based flooding

E N D
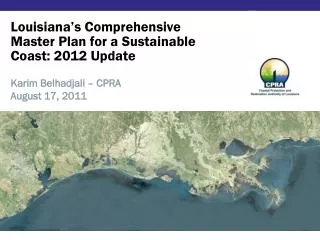
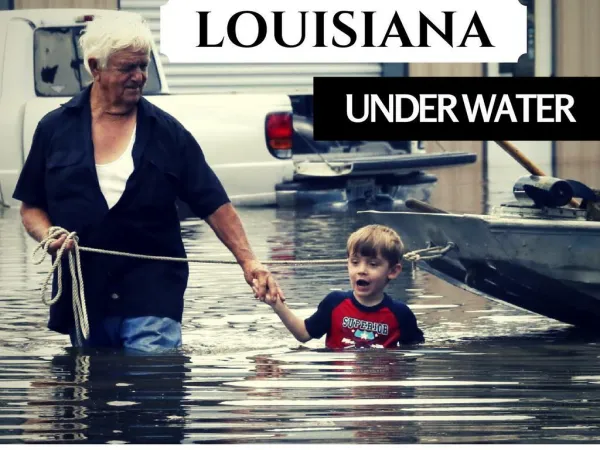
Karim Belhadjali – Coastal Protection and Restoration Authority Louisiana’s Comprehensive Master Plan for a Sustainable Coast: 2012 Update
Linking Back to Master Plan Objectives • Reduce economic losses from storm-based flooding • Promote a sustainable coastal ecosystem by harnessing natural system processes • Provide habitats suitable to support an array of commercial and recreational activities coast-wide • Sustain Louisiana’s unique heritage and culture 5. Provide a viable working coast to support industry.
Key Components of 2012 Update • Specific & Realistic Goals & Objectives • Prioritized Project List • Map showing the selected projects and what they provide: • Levels of risk reduction • Levels of ecosystem services across the coast • Extent and character of future landscape • Detailed Implementation plan with: • Schedule, Costs, Expected sources of funding • Adaptive Management plan to guide implementation
Elements of 2012 Master Plan with Building Blocks for Other Efforts
Review and Coordination CPRA Coastal Protection and Restoration Authority Science & Engineering Board (MP-SEB) Master Plan Delivery Team Prioritization Tool Technical Advisory Committee Cultural Heritage Technical Advisory Committee Framework Development Team (FDT) Project Effects Models Technical Advisory Committee Modeling Workgroups Stakeholders
Technical Advisory Committee Members Project-Effects Models • Steve Ashby, USACE Eng. Res. Dev. Center • John Callaway, University of San Francisco • Fred Sklar, South Florida Water Mgmt. District • Si Simenstad, University of Washington Prioritization Tool TAC • John Boland, John Hopkins • Ben Hobbs, John Hopkins • Len Shabman, Virginia Tech Cultural Heritage TAC • Don Davis, Louisiana State University • Carl Brasseaux, University of Louisiana Lafayette • Maida Owens, LA Dept. of Cultural, Recreation, Tourism
National Science and Engineering Board -Independent Technical Review Ecosystem Science / Coastal Ecology • William Dennison, University of Maryland • Edward Houde, University of Maryland • Katherine Ewell, University of Florida Engineering • Robert Dalrymple, Johns Hopkins University • JosDijkman, Deltares Geosciences • Charles Groat, University of Texas at Austin Social Science and Risk • Greg Baecher, University of Maryland • Philip Berke, University of North Carolina – Chapel Hill Climate Change • Virginia Burkett, U.S. Geological Survey Environmental/Natural Resource Economics • Edward Barbier, University of Wyoming
Framework Development Team-Over 30 Federal, State, NGO, Academic, Community, and Industry Organizations
Predictive Modeling Team • CPRA Team Leads • Mandy Green (Planning) • Carol Parsons-Richards (LACES) • Technical Lead • Dr. Denise Reed (UNO) • Technical Coordination • Alaina Owens (Brown and Caldwell) • 7 Model Teams • Over 50 Experts
Technical Advisory Committee (TAC) Predictive Models • Dr. Steve Ashby, USACE - Engineer Research and Development Center • Dr. John Callaway, University of San Francisco • Dr. Fred Sklar, South Florida Water Mgmt. District • Dr. Si Simenstad, University of Washington
Predictive Models Overview • Eco-Hydrology • Mass-balance box model • Output – 16 variables • stage, salinity, sediment, water quality • Wetland Morphology • 4 submodels - changes in the landscape • Output – land change, fragmentation, elevation, SOC • Barrier Shoreline Morphology • Changes in tidal inlet area, location, area, and elevation • Vegetation • Probability of death / establishment of 21 vegetation classes, per salinity, inundation
Predictive Models (cont’d.) • Upper Trophic Level • Habitat Suitability Indices • 14 species and 1 functional group • Storm Surge and Wave • Coarsened AdCirc grid (used by USACE) • Use output from wetland /barrier morphology and vegetation to modify grid points • Output – storm surge and wave elevation • Risk Assessment (damage) • Surge elevation, value of assets (commercial, residential, infrastructure, strategic assets) • Output – flood depths and resulting residual damages ($) • Data Integration • File naming, automations, model linkages and data transfer
Modeling in a Systems Context Data Integration Stage, Salinity, Water Quality Stage, Salinity Land Configuration, Elevation Stage, Salinity Sediment Dominant Vegetation Dominant Vegetation Upper Trophic Eco-Hydrology Wetland Morphology Vegetation Land Configuration, Elevation Habitat Suitability Index Island Configuration Land Configuration, Elevation Dominant Vegetation Barrier Island Morphology Stage Surge Damage Surge, Waves Damage, $ Surge, Waves
Modeling in a Systems Context Data Integration Stage, Salinity, Water Quality Stage, Salinity Land Configuration, Elevation Stage, Salinity Sediment Dominant Vegetation Dominant Vegetation Upper Trophic Eco-Hydrology Wetland Morphology Vegetation Land Configuration, Elevation Habitat Suitability Index Island Configuration Land Configuration, Elevation Dominant Vegetation Barrier Island Morphology Stage Surge Damage Surge, Waves Damage, $ Surge, Waves
2. OUTPUTS • Land change • Fragmentation • Elevation • Soil Org C • 4. INPUTS • Vegetation Distribution • Land area/ distribution • Elevation • Water level • Salinity • Nitrogen • 4. OUTPUTS • % of each vegetation class in each cell • 5. INPUTS • Water depth & fluctuation • Salinity; Water temp • TSS ; Dissolved O • Chlorophyll a • Marsh edge; % open water • % emergent veg (by type) • River nutrients • Island surface area & distance • % submerged substrate covered by emergent veg • Water depth in wooded wetlands • % area within 3 km (< 9 ppt salinity & depth 1-30 cm) • % area (1-12 cm deep) • % area within 10 km (1-12 cm deep) • % cultch cover on bottom • Similarity index around the cell • 5. OUTPUTS • Habitat Suitability Indices for 15 species: • Crawfish • Alligator • Largemouth bass • Mottled duck • Gadwall • Green-wing teal • River otter • Muskrat • White shrimp • Brown shrimp • Oyster • Spotted sea trout • Roseate spoonbill • Neotropical migrants • Black drum • 1. INPUTS • Wind speed & direction • Water depth • Salinity • Water temp • Land area • Gulf stage • Gulf salinity • Gulf nutrients • Air temp • Riv discharge • Riv sediment • Riv nutrients • Diversion flows • Atmospheric deposition • Rainfall • Evapotrans • 2. INPUTS • Land/water • Land change rates • Elevation • Avg band 5 Reflectance • Eustatic SLR • Subsidence • Compaction • Freshwater input • Sed supply • Bulk density, %OM, %mineral • Accretion & elev • Salinity • Inundation • Marsh type & dominant species • SURRGO Soils • 1. OUTPUTS • Stage • Salinity • Water temp • Sed retention • Accretion • Total Kjeldahl N • Tidal prism • Nitrate + nitrite • Ammonium N • Dissolved org N • Total P • Dissolved org P • Dissolved inorg P • Chlorophyll a • Detritus • Residence time • N removal rate Inputs, Outputs 5. Upper Trophic 4. Vegetation 2. Wetland Morphology 3. Barrier Morphology 6. Surge 7. Damage 1. Eco-Hydrology • 6. INPUTS • Land area distribution & elev • % of each vegetation class • Barrier island geometry • Inlet config • Shoreline position • 6. OUTPUTS • Surge hydrographs • Waves • 7. INPUTS • Surge hydrographs • Waves • Protection system inputs • 3. INPUTS • Historical shoreline & bathymetry • Tidal inlet configuration • Sediment character • LiDARelev • Land area distribution & elev • Waves & surge • Water elev & tidal velocity at inlets • 3. OUTPUTS • Barrier area & geometry • Inlet config • Shoreline position • 7. OUTPUTS • Residential risk/damage
Modeling Status and Next Steps • All of the modules are running • FWOA in progress • Production mode • On-going technical oversight (TAC) • Assessment of model uncertainty • USACE model certification
2012 Master Plan Outputs • Maps showing ranges of Master Plan outcomes • Levels of flood protection • Levels of ecosystem services • Extent and character of landscape • Adaptive management plan to guide implementation • Maps of near-term projects • Maps of potential future project • Schedule • Costs • Expected sources of funding
Questions?For more information, send an e-mail to MasterPlan@la.gov or go to coastalmasterplan.la.gov
Uncertainty Analysis 1) Sea level rise 2) Subsidence 3) Marsh collapse threshold 4) Storm frequency and intensity 5) River discharge 6) Rainfall 7) Evapo-transpiration 8) Nutrients Ecosystem Modules Bathy-topo outcomes Surge/WaveModule Ecosystem service outcomes 9) Demographics 10) Induced development 11) Drainage performance 12) Structural system fragility 13) Effectiveness of non- structural measures Flood Damage Module 16 uncertainties identified by modeling groups Flood damage outcomes Prioritization Tool 14) Project costs 15) Project time to completion 16) Available funding