Download
1 / 26
260 likes | 364 Views
Evaluation and integration of multiple datasets using Bayes theorem. John van Dam. How can we integrate multiple datasets?. Proteomics data. ?. Published data. Genetic data. Expression data. Evolutionary data. How can we integrate multiple datasets?. Proteomics data. Published data.

E N D
Evaluation and integration of multiple datasetsusing Bayes theorem John van Dam
How can we integrate multiple datasets? Proteomics data ? Published data Genetic data Expression data Evolutionary data
How can we integrate multiple datasets? Proteomics data Published data Genetic data Expression data Evolutionary data
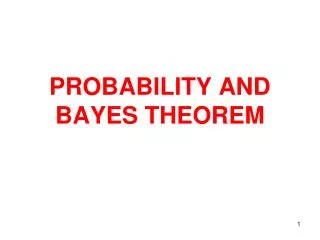
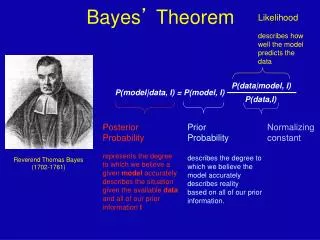
Thomas Bayes (1701 – 1761) • Presbyterian minister • Fellow of the Royal Society • Published two works: • A religious essay • An essay defending the work of Sir Isaac Newton • His work on the “Bayes’ theorem” was published by Richard Price in 1763 • Mathematics of probabilities • A hot topic in science in early 18th century • A lot of people at the time were interested in mathematics, statistics and probabilities because of gambling!
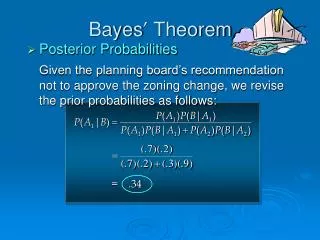
Bayes’ theorem P(A|B) = Probability of A given observation B P(B|A) = Probability of observation of B given A P(A) = The a priori probability of A P(B) = The probability that B is observed Bayes’ theorem deals with “inverse probabilities”
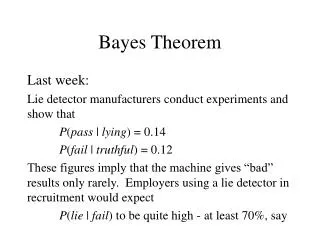
Example: • A friend tells you he had a nice conversation with someone in the train to Nijmegen • What is the chance that this other person is a woman? • Your friend only tells you that this person has long hair. • Does this change the previous probability? • Say: • 75% of women have long hair • 15% of men have long hair
Bayes’ theorem • What if your friend told you that this person was also wearing high heels? • We can use P(W|L) as the new prior! • This is called Bayesian updating • You adjust your ‘belief’ with each new piece of information! • Bayesian updating assumes no relationship between L and H other than via W!
Bayesian odds For convenience we can rewrite Bayes’ equation into odds (or Bayes factor)
Bayesian odds If we now perform Bayesian updating we can simply write
Beware of ‘extreme’ cases (or priors) • “A Bayesian is one who, vaguely expecting a horse, and catching a glimpse of a donkey, strongly believes he has seen a mule.” • http://www2.isye.gatech.edu/~brani/isyebayes/jokes.html • What did we just “probabilistically” describe if the person was actually a man?
How can we integrate multiple datasets? Proteomics data Published data Genetic data Expression data Evolutionary data
Ciliated tissues (some examples) Inner ear: Cilia function in hearing and balance Sperm cells Cerebral cavities, Bronchia & Fallopian tubes Retina: Cones and Rods
Bayesian integration on SysCilia data • Tandem Affinity Purifications & SILAC • Yeast 2 Hybrid screens • Ciliary evolutionary co-occurrence • Gene presence/absence profiles matching ciliary presence/absence • System co-expression • Genes with XBOX transcription factor binding sites • What is the probability that gene X is ciliary given thatit is reported by experiments 1, 2, 3, …, and n?
Bayesian integration of multiple observations • n is the number of datasets considered • fi= dataset i • P(fi|T) = probability that a gene is reported by dataset i given it is a known ciliary gene • We take log odds because deviations, caused by rounding and measurement errors, are not enlarged with each multiplication
Can we say something about genes that were not reported? In case of yes/no experiments, “No” can also have meaning. In case we have a result which has a value, we can use categories.For instance: Each gene falls into one category for each experiment.
Evaluating True and False per experiment • We need a list of known ciliary genes (a Gold Standard) • We need a list of known non-ciliary genes (a Negative Set) • Then simply becomes Fraction of GS reported by experiment i Fraction of NS reported by experiment i
Ranking based on Bayesian integration Ciliary Predicted Non-ciliary The Bayesian integration enriches for more known ciliary genes, than the individual datasets. We can control for False Discovery Rate.
Application of the Bayesian integration • Predicting causative genes in ciliopathy disease loci or exome data • Predict which genes are likely involved in ciliary function, and which are not • Example BBS5 locus (182 genes):
Conclusion • Bayesian integration is a powerful way to predict novel ciliary genes by objective evaluation and integration of experimental datasets • New datasets can easily be incorporated • You can use such a Bayesian integration to • Predict novel ciliary genes • Rank target genes from new experiments • Predict causative genes in patient exome data
Acknowledgements Ueffing lab, Tübingen Huynen Lab, Radboud UMC Roepman lab, Radboud UMC Oliver Blacque, UCD Dublin