Download
1 / 33
390 likes | 694 Views
SPECIES ABUNDANCE AND DIVERSITY. Chapter 16. TWS Thu 7:15 pm CL 230. Turtles, squirrels, and dead birds Dr. Travis Ryan Butler University. Inqsit exam starts Thu. Short answer version Multiple choice version. Objectives. Define “ecological community” and describe major characteristics.

E N D
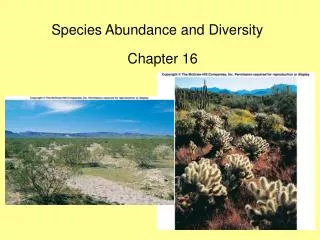
SPECIES ABUNDANCE AND DIVERSITY Chapter 16 Molles: Ecology 2nd Ed.
TWSThu 7:15 pmCL 230 Turtles, squirrels, and dead birds Dr. Travis Ryan Butler University Molles: Ecology 2nd Ed.
Inqsit exam starts Thu Short answer version Multiple choice version Molles: Ecology 2nd Ed.
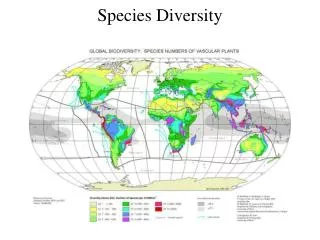
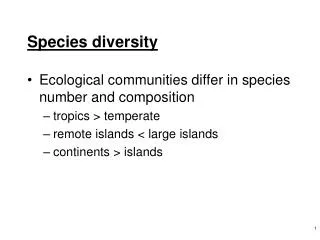
Objectives • Define “ecological community” and describe major characteristics. • Quantify species abundance and species diversity. • Describe the processes that determine species diversity of communities. • Explain how environmental factors influence species diversity. Molles: Ecology 2nd Ed.
Community • An association of interacting species that occurs in defined area. • Interactions include competition, exploitation, and mutualism. • Entire community, bird community, plant community, insect community…. Molles: Ecology 2nd Ed.
Community Characteristics and Processes Species Composition - Number of species - Relative abundance Species Emigration Species Immigration Speciation Extinction Community Structure (Height, Layers) Species Diversity
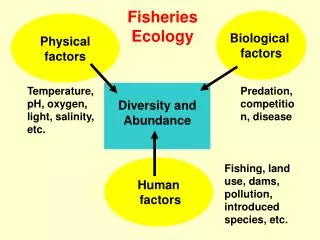
Quantifying Species Abundance • Abundance: The actual number of organisms of a species per unit of area or volume (Density). • Relative Abundance: The proportion or percentage of all organisms in a community or sample that are a particular species. RA = # of species A / total # organisms
Species Abundance Relative Abundance Clam 24 0.048 (= 24/500) Snail 18 0.036 (= 18/500) Mayfly larvae 11 0.022 Caddisfly larvae 41 0.082 Dragonfly Larvae 8 0.016 Midge larvae 203 0.406 Worm 150 0.300 Leech 45 0.090 Total 500 1.000 Example: A representative sample of 500 stream invertebrates is collected:
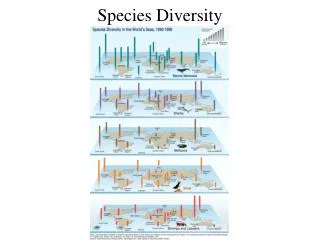
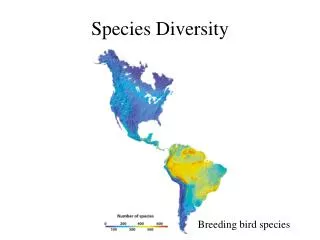
Species Abundance • How common are most species? • There are regularities in relative abundance of species in communities in all ecosystems • Preston developed concept of: • Distribution of commonness and rarity Molles: Ecology 2nd Ed.
Log-Normal Pattern of Species Abundance In Communities Very few species have extremely high relative abundance Why ? Very few species have extremely low relative abundance Low AbundanceHigh (Log Scale) Most species are moderately abundant Plants Birds
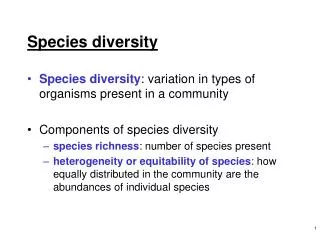
Species Diversity Two factors define species diversity: Species Richness: Number of species in community Species Evenness: Relative abundance of species Molles: Ecology 2nd Ed.
Both have 5 species = same species richness Fig 16.5 Molles: Ecology 2nd Ed.
Quantitative Index of Species Diversity • Shannon-Wiener Index: s H’ = - pi logepi i=l H’ = Shannon-Wiener diversity index pi = proportion of the ith species loge = natural logarithm of pi. s = number of species in community Molles: Ecology 2nd Ed.
H’ example • Community: S = 7 AAAAAAAAAA AAAAAAAAAA AAAAAAAAAA AAAAAAAAAA AAAABCDEFG • Sum values across all species • pi = 44/50 = 0.88, pi = 1/50 = 0.02 • Calculate ln for each (ln 0.88 = - 0.128) Molles: Ecology 2nd Ed.
H’ • Sum pi’s • = 0.88 (-0.128) + 0.02 (- 3.91) +0.02 (- 3.91) + 0.02 (- 3.91) + 0.02 (- 3.91) + 0.02 (- 3.91) + 0.02 (- 3.91) = - 0.58 • Change sign; H’ = 0.58 Molles: Ecology 2nd Ed.
Another example: • Community: S = 5 ABCDEABCDE ABCDEABCDE ABCDEABCDE ABCDEABCDE ABCDEABCDE • H’ = 1.61 Molles: Ecology 2nd Ed.
What’s the purpose of H’? • Includes both species richness and evenness Molles: Ecology 2nd Ed.
Rank Abundance Curves • Relative abundance and species diversity in community: plot relative abundance of species and rank abundance Fig 16.8 Molles: Ecology 2nd Ed.
Environmental Complexity Species diversity increases with environmental complexity MacArthur: warbler diversity increased = vegetation stature increased Env. complexity = foliage height Many find positive relationship between env. complexity and species diversity Molles: Ecology 2nd Ed.
Fig 16.9 Molles: Ecology 2nd Ed.
Algal and Plant Species Diversity And Increased Nutrient Availability • Repeatedly observed negative relationship between nutrient availability and algal and plant species diversity • Adding nutrients to water or soils reduces diversity of plants and algae • Reduces number of limiting nutrients Molles: Ecology 2nd Ed.
Disturbance and Diversity • Disturbance difficult to define because it involves departure from “average conditions.” • Average conditions may involve substantial variation Molles: Ecology 2nd Ed.
Sousa defined disturbance: • Discrete, punctuated, killing, displacement, or damaging of one or more individuals that directly or indirectly creates an opportunity for new individuals to be established Molles: Ecology 2nd Ed.
Disturbance and Diversity • Another definition of disturbance: • Any relatively discrete event in time that disrupts ecosystem, community, or population structure and changes resources, substrate availability, or the physical environment Molles: Ecology 2nd Ed.
Two major characteristics of disturbance: Frequency Intensity Molles: Ecology 2nd Ed.
Intermediate Disturbance Hypothesis • Connell • disturbance is a prevalent feature that significantly influences community diversity • Proposed that both high and low levels of disturbance reduce diversity • Intermediate levels promote higher diversity Molles: Ecology 2nd Ed.
Sufficient time between disturbances allows wide variety of species to colonize, but not long enough to allow competitive exclusion Molles: Ecology 2nd Ed.
Disturbance and Diversity in The Intertidal Zone • Sousa studied effects of disturbance on diversity of algae and invertebrates growing on boulders in the intertidal zone • Predicted level of disturbance depends on boulder size Molles: Ecology 2nd Ed.
Fig 16.18 Large boulders move less = heavier Boulders with highest diversity of species had intermediate levels of disturbance Molles: Ecology 2nd Ed.
Disturbance and Diversity inTemperate Grasslands - burrowing as a disturbance • Whicker and Detling • prairie dogs (Cynomys spp.) source of disturbance on N. A. prairies • Build extensive burrow systems • Move 200-225 kg soil from underground to entrance Molles: Ecology 2nd Ed.
They removed vegetation around burrows • Area opens to colonization • Pest control programs reduced prairie dog populations 98% • Eliminated dynamic influences on plant communities Molles: Ecology 2nd Ed.
Summary • Most species are moderately abundant; few are very abundant or extremely rare • A combination of the number of species and their relative abundance defines species diversity • Species diversity is higher in complex environments • Intermediate levels of disturbance promote higher diversity Molles: Ecology 2nd Ed.