Download
1 / 20
440 likes | 1.3k Views
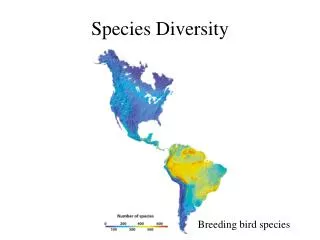
Species diversity indices. Are these two communities equally diverse?. 3 Ways to include abundance in species diversity. Plot the distribution of individuals amongst species. Summarize both abundance and species richness in a single index.

E N D
3 Ways to include abundance in species diversity • Plot the distribution of individuals amongst species. • Summarize both abundance and species richness in a single index. • Examine the evenness of the distribution of individuals amongst species
1. Plot the distribution of abundance amongst species • Three models have been proposed: • Log-series • Broken stick • Log-normal • All are supported by data • None have a good theoretical explanation • (save Stephen Hubbell’s neutral model, 2001) • Hard to tell apart statistically!
Log-series Most species are represented by only a couple of individuals (i.e. rare). Only a few highly-abundant (i.e. common) species. 100 Straight line predicted Log abundance per species 10 1 1 2 3 Linear species rank (1=most abundant)
50 Straight line predicted Linear abundance per species 40 30 20 10 1 10 100 Log Species rank (1=most abundant) Broken-stick • More equitable distribution of abundances amongst species than log-series. • Like log series most species have a fairly low abundances.
Log-series revisited “Most species are rare” 100 Log abundance per species Number of species 10 1 1 2 3 Log abundance class per species Linear species rank (1=most abundant)
Log-normal Most species are do NOT have abundances of only a few individuals, but rather have intermediate abundances (on a log scale! Still low) Number of species Log normal Log abundance class per species
2003 class mite data Essentially number of species Log2 abundance class PRIMER “Geometric class plot”
2003 class mite data Linear abundance per species Log species rank PRIMER “Dominance plot”
2. Summarize everything in one index Some indices output by PRIMER (formulas in Krebs and Magurran) • Simpson’s (1-lambda, or 1-D in Krebs) • Shannon-Wiener • Alpha (a parameter from log series) • Margalef d
Shannon-Wiener = sum(-Proportion spA * ln (prop spA)+ (-Proportion spB*ln(prop spB)...)
Which index? Read Krebs and Magurran and consider: - Sensitivity to differences in sample size. - Do you want differences in rare or abundant species to be emphasized? - Do you want differences in species richness or evenness to be emphasized? - How does log-normal vs. log-series affect? - Performance in other studies (what works?).
3. Measure evenness separately • Pielou’s J: Comparison of actual Shannon-Wiener with Shannon-Wiener if species had equal proportion (log S). • Close to 1: very even distribution of abundances amongst species • Close to 0: very uneven
Smarties revisited! • 1. Count your smarties. Each colour is a different species. • 2. Does your distribution fit log-series or log-normal? (Use log 2 abundance classes to make bar graph). • 3. Calculate the following diversity/evenness indices: • Simpson’s • Shannon-Wiener • Pielou’s J