Download
1 / 37
370 likes | 552 Views
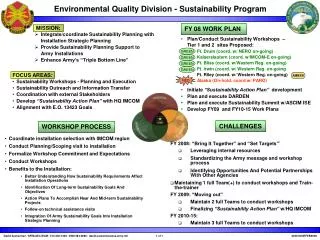
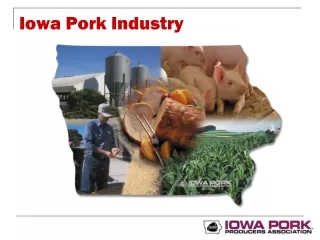
Pork Industry Environmental Sustainability Program. Allan Stokes Director Environmental Programs. Sustainability. Merriam Webster ”of, relating to, or being a method of harvesting or using a resource so that the resource is not depleted or permanently damaged “ U.S. EPA Website

E N D
Pork Industry Environmental Sustainability Program Allan Stokes Director Environmental Programs
Sustainability Merriam Webster • ”of, relating to, or being a method of harvesting or using a resource so that the resource is not depleted or permanently damaged “ U.S. EPA Website • “The traditional definition of sustainability calls for policies and strategies that meet society’s present needs without compromising the ability of future generations to meet their own needs. ”
Four Pillars of Pork Industry Environmental Sustainability Program
Pork Industry Environmental Sustainability Program • Carbon Footprint / Energy Use – 2010 - 2011 • Greenhouse gas (GHG) emissions • Carbon Dioxide, Nitrous Oxide, Methane • Water Footprint - 2011 • Water use & consumption / water quality impacts • Air Footprint - 2011 - 2012 • Non-greenhouse gas air emissions • National Air Emissions Monitoring Study NAEMS) – 2007 – 2010 -Completed • Process-based Air Emissions Model for Swine – 2010-2012 • Land Footprint – 2013
Pork Industry Environmental Sustainability Program - Why • Doing What’s Right • Produce Safe Food • Protect And Promote Animal Well-Being • Ensure Practices to Protect Public Health • Safeguard Natural Resources In All Of Their Practices • Provide A Work Environment That Is Safe • Contribute To A Better Quality Of Life In Their Communities
Pork Industry Environmental Sustainability Program - Why • Addressing a Changing Marketplace • Consumers increasingly removed from agriculture • Consumers want more information about their food & environmental impacts • Increasing pressure from interest groups & media • Need to build & maintain trust
Pork Industry Environmental Sustainability Program - Why • Benefits to Producers • Model to define facility footprint, analyze “hotspots” & options & Evaluate different technology & practices for impacts • Improved management efficiency • Reduced input costs • Potential new revenue sources • Measure Industry Progress
Pork Industry Environmental Sustainability Program - Why • Identify Areas For Further Industry Progress • Research • Education & Outreach • Provide Sound Science-based Information To • Meet customer / consumer expectations & requirements • Answer / preempt attacks by interest groups • Support dialogue on issues
Pork Industry Environmental Sustainability Program - How • Literature Review / Meta-Analysis • What is already known as it relates to pork • Scan Life-cycle Analysis (LCA) - Pork Chain • Across entire pork chain “field to fork” • Low resolution – high aggregation of data • Detailed Life-cycle Analysis - Live Swine • Focus on swine production segment of pork chain • High resolution – low aggregation of data • “Field to farm gate”
Pork Industry Environmental Sustainability Program - How • Life Cycle Analysis A system level accounting associated with a product, service or activity (life-style) that includes extraction from nature & contributions from other associated products or services. An analytical tool for making calculations. • Following methods & processes outlined by International Standards Organization (ISO) guidance • Open sources of data used to fullest extent possible • Open & transparent process • Independent peer review panel consistent with ISO guidance
Pork Industry Environmental Sustainability Program - How Life Cycle Analysis – 4 Phases Attributes or characteristics of product or process Environmental effects of product or process
Pork Industry Environmental Sustainability Program - How • Pork Industry LCA - Goal & Scope • Goal • Pork Supply Chain Scan Level LCA based on - 1 serving of pork (4 ounce) to consumer in U.S. • Detailed Live Swine Production LCA based on – 1 pound live weight sent to harvest • Scope • Field to Finished Product • Exclude infrastructure (buildings/equipment/etc.)
Life Cycle Analysis Inventory Releasesto environment Inputs Outputs • An accounting of inputs and outputs for all stages of a product Extractions from environment
Life Cycle Analysis Inventry • Allocation of contribution • Economic allocation • Feed byproducts • Rendering co-products • Space allocation • Retail • In-home
Life Cycle Analysis Impact Assessment Identify ‘hotspots’ for innovation
Pork Carbon Footprint Project • National Pork Board Resolution - June 2008 • The carbon footprint of U.S. pork production is an emerging issue that is of significant importance to the pork industry and its customers. The board directs National Pork Board Staff to thoroughly evaluate this issue in order to define our opportunities and challenges, from which solutions that are ethically grounded, scientifically verifiable and economically viable can be implemented.
Pork Carbon Footprint Project - What • A system level accounting (LCA) of Greenhouse Gas (GHG) emissions associated with pork production • 3 Primary gases in livestock agriculture • Measurement of heat trapping potential in atmosphere over a period of time • Expressed as carbon dioxide (CO2e) equivalent values
Pork Carbon Footprint Project - Who • Working Group Provide counsel and input to National Pork Board and contractor(s) in pork carbon footprint initiative process • Pork producers • NPB staff (All Departments) • NPPC • Other stakeholders (Feed & grain, processor & packers, retail) • Univ. of Arkansas - Applied Sustainability Center • Contract Technical Assistance to National Pork Board
Pork Carbon Footprint Project - 3 Step Project • Literature Review • Completed • Pork Chain Scan Level Life Cycle Analysis • Preliminary completed • Update In Progress based on detailed live swine analysis • Detailed Live Swine Life Cycle Analysis • In Progress • Scheduled completion - December 2010
Literature Review - Results • No Life Cycle Analysis of U.S. Pork Chain for Greenhouse Gas Emissions • Research on emissions focused on odor & dust • Lack reliable body of information on nitrous oxide emission for animal production • Additional data needed across entire pork chain to allow for most accurate LCA possible • Most Work Done In Europe – Denmark • While similarities – not directly transferable to U.S. • Different scope • Different functional units .
Literature Review - Results Swine production LCA - other countries Summary of EU pork production GWP data: Functional unit = 1kg carcass at farm gate * Corrected from live weight to carcass weight.
Literature Review - Results Contribution to global warming potential from the different stages of the pork production chain in Denmark (Dalgaard et al., 2007 – used with permission) Swine production LCA - Denmark Includes Manure Storage • Functional unit = 1 kg pork delivered to the Port of Harwich, Great Britain
Scan Level LCA for U.S. Pork Chain • Some Underlying Assumptions Made • 9.5 piglets/litter and 3.5 litters per sow • Finished live weight: 268 lb • Carcass = 0.75 live weight • Boneless = 0.65 carcass • Typical corn, soy meal, distiller’s grain diets • ASABE ‘standard’ manure characteristics1 • IPCC Tier 2 GHG emission factors for manure systems2 • Crop sequestration & animal respiration excluded • 10% waste (spoiled or uneaten) by consumers 1 American Society of Agricultural Engineers, 2005 ASAE D384.2 MAR2005. 2 Dong, H., et al. (2006) Chapter 10 6 IPCC Guidelines for National Greenhouse Gas Inventories.
Scan Level LCA for U.S. Pork Chain • Some Preliminary Results • The contribution of GHG emission : • 13.6%: sow barn (including feed &manure handling) • 53%: nursery to finish (including feed &manure handling) • 6.7%: processing and packaging • 14%: retail (electricity &refrigerants) • 13%: the consumer (refrigeration & cooking) • Variability exists • Based on type of manure management • Based on region of country
Scan Level LCA for U.S. Pork Chain Based on GWP Kg CO2e / 1 kg carcass at farm gate *Based on Preliminary Data
Detailed Live Swine LCA for U.S. Pork • Technical LCA Work • In progress • December 2010 scheduled completion • Scan level of pork chain being updated with new information • Rollout Program to Multiple Audiences • Under development • Phased rollout January – July 2011
Pork Industry Carbon Footprint Project – Next Steps • Identify Additional Research Needs • Identify Education & Outreach Opportunities to Inform Producers on Existing Known Mitigation Practices & Technologies • Develop new Education & Outreach Tools & Materials
Interpretation Phase Is Critical Greenhouse Gas Emission Example Based on U.S. EPA GHG Report 2007 & USDA / Industry Pork Production Data
Interpret Data In Like Methods • U.N. FAO 2006 Report – Livestock’s Long Shadow • 18% of Global GHG emissions from livestock – more than entire transportation sector & Infers that this is same case for U.S. BUT • Authors Now Admit Different Scopes of Analysis Were Used
Interpret All Data • UN Framework Convention on Climate Change (UNFCC) 2008 Technical Report • Agriculture contributes 10–12 % of total global anthropogenic GHG emissions …… • In 2005, regional emissions were highest in South & Southeast Asia & Latin American countries …… • Effective means for reducing emissions associated with conversion of land to agriculture is through intensification of agriculture, that is, by producing more on land already in production …….
Be Realistic In Evaluation & Expectations UN Framework Convention on Climate Change (UNFCC) 2008 Technical Report • There are limitations to emissions reductions in the agriculture sector particularly because of the role of the sector in providing food for a global population that is expected to continue to grow in the coming decades. Therefore, it would be reasonable to expect emissions reductions in terms of improvements in efficiency rather than absolute reductions in GHG emissions.
Focus On What Really Matters • Base decisions on complete quality assured data • Focus on U.S. production systems & realities • Focus on relative risks • Keep things in perspective • Focus on the end product • Livestock & poultry are food animals
Allan Stokes • National Pork Board • 1776 NW 114th Street • Clive, Iowa 50325 • Email: Astokes@pork.org • Phone: (515) 223-3447