Download
1 / 20
200 likes | 319 Views
GIS at Brabant Water. GEOSPATIAL WORLD FORUM Amsterdam April 2012. Agenda. Brabant Water Water distribution GIS. Waterworks in the Netherlands*. WBG 280. *connections (x1000) 01-01-2011. WMD 190. PWN 750. Waternet 480. Dunea 600. Vitens 2400. 330 Oasen. Evides

E N D
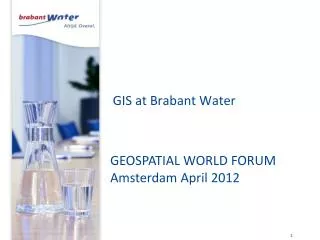
GIS at Brabant Water GEOSPATIAL WORLD FORUM Amsterdam April 2012
Agenda • Brabant Water • Water distribution • GIS
Waterworks in the Netherlands* WBG 280 *connections (x1000) 01-01-2011 WMD 190 PWN 750 Waternet 480 Dunea 600 Vitens 2400 330 Oasen Evides 1000 Brabant Water 1100 WML 530
Waterworks in the Netherlands* WBG 282 *connections (x1000) WMD 193 PWN 750 Waternet 480 Dunea 603 Vitens 2400 335 Oasen Brabant Water 1100 Evides 105 Brabant Water 1100 WML 532
Supply area Brabant Water Behoort tot het voorzieningsgebied van Evides Regio West Regio Midden Regio Noord Oost Regio Zuid Oost
Offices and production locations Drinkwaterproductiebedrijf Industriewaterproductiebedrijf Hoofdkantoor Nevenvestiging en regiokantoren Regiokantoor
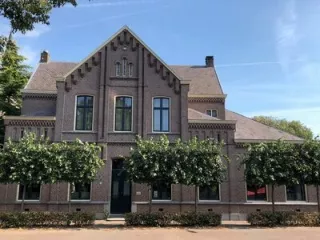
Head office 's-Hertogenbosch Paleiskwartier
Renewal main system • Malfunction • Complaints • Pipe materials • Building year • Plans from other utility companies • Plans from local government
Call before you dig • Information exchange • WION uses GIS • WION sends network information to contractors • Excavation polygons in GIS
Managing change requests • Whishes and requests on an Gissue list • Product owner sets priority • Team develops functionality • Testing by business • Implementation • Scrum methodology
Key figures • Production in m3 per year 190 million • Main system 18.000 km • Amount connections 1,1 million • Amount inhabitants 2,4 million • Amount production facilities 33 • Turnover per year € 220 million • Amount of employees 800
Questions? daan.van.os@brabantwater.nl