Download
1 / 33
360 likes | 541 Views
Water Utility GIS. Development of Property, Operational, and Base Map Layers for Online Consumption. Agenda: Business Reality & Needs Objective Project Timeline Methodology References Christopher Kahn Senior Engineering Technician, GIS January 7 th , 2010

E N D
Water Utility GIS Development of Property, Operational, and Base Map Layers for Online Consumption Agenda: Business Reality & Needs Objective Project Timeline Methodology References Christopher Kahn Senior Engineering Technician, GIS January 7th, 2010 Advisor – Dr. Patrick Kennelly
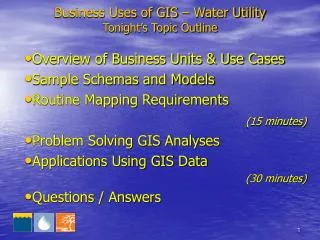
Utility Only O&M Only Both American Water is the largest investor-owned water and wastewater service provider in the United States. • Provide services to approximately 15 million people in more than 1,600 communities in 32 states and in Ontario, Canada • Employ approximately 7,000 employees • Treat and deliver over one billion gallons of water daily
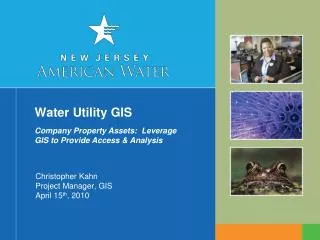
New Jersey American Water • New Jersey is largest of American Water states • 875 Employees • 9500 miles piping • 17 Counties, 181 Municipalities • Over 500 properties • Thousands of easements • 3 Full-Time GIS staff • Growth Via: • New construction, New systems • Variety of legacy mapping & record systems • 2006 - 2008 GIS Conversion Project • Only network assets converted to GIS • No “Land Base” created
Business Reality Over 500 properties across state Existing databases vary in completeness & formatting: Tax, Legal, Environmental Compliance, Asset Planning, etc Satisfy the individual needs of departments Not comprehensive; No mapping component Insufficient forRegulatory orManagement: Map requests Comprehensive data requests Requests that require spatial overlay Spatial or attribute query requests GIS analysis requests No “Self-Help” … all property map requests require research. 4
Elizabethtown Water Company Property (200+ records) Existing Database Sample: 5
New Jersey American Water Property (400+ records) Existing Database Sample: 6
Environmental Compliance Database (300+ records) Existing Database Sample: 7
Facility / Property Database (907 records) Existing Database Sample: 8
Business Need Seamless property database in GIS Simple schema with logical key field (PAMS) Web Access for “Non-GIS” users Basic “common” attribution Basic query & search tools Basic printing tools Rich custom base map Water network overlay Optional enhancements: “Value Add” layers (solar potential, conservation value, etc) Thematic layers (tax info by county, borough, etc) Operational layers User editing capability Digitize & link to deeds from Legal Department 9
Objective The objective of this project is to create an efficient way to access & edit New Jersey American Water property information, as well as view contextual GIS layers, through a map-based web interface. Goals: The primary goal is to design and build an up to date, seamless GIS property layer for New Jersey American Water. The secondary goal is to provide an efficient way to access, query, edit, and print property information for end users with or without GIS knowledge. The tertiary goal is to design a base map that uses cartographic design principles to support users in a variety of geospatial water utility tasks.
Methodology • Identification of business need • Determine objective • Requirements / Data gathering • Schema design • Database population • Web map design • Services • Map documents • Base map layers • Operational layers • Thematic layers • Tools • Testing
Objective – Methodology Relationship The goal of this project is to create an efficient way to access & edit New Jersey American Water property information, as well as view contextual GIS layers, through a map-based web interface.
Aug Sept Oct Nov Dec Jan Feb Mar Prep Requirements & Data Gathering MethodologyTimeline Schema Populate Database Develop Peer Review Presentation Base Map Document Design Web Application Design iterative Web App Tool Design iterative Conference Presentation: Thematic Layer Development American Water Works Association Annual Conference (NJ Chapter) – Atlantic City – April 15th 2010 Thematic Tool Design Finalize Presentation Conference 13
Content Data & Requirements Gathering • Met with stakeholder department leads • Collected databases from these departments • Tax, Legal, Environmental Compliance, Asset Planning • Determined minimum fields necessary for GIS • Determined relative completeness & accuracy of each DB • Elected “Tax” records as starting DB point • Determine link to upcoming NJ State Parcel layer (PAMS)
Parcels (NJ State Layer) Parcels (NJAW) Domain : Code Code Name Code Name 01 Atlantic 02 Bergen etc , etc Code Name Code Name Content Parcels Abstract Class Schema Design + PAMS_PIN : esriFieldTypeString (38) + MUN : esriFieldTypeString (4) + BLOCK : esriFieldTypeString (10) + LOT : esriFieldTypeString (10) + QCODE : esriFieldTypeString (11) + LASTUPDATE : esriFieldTypeDate Domain : Town (4) + COUNTY : Code + MUN :Town + ADDRESS : esriFieldTypeString (50) + ACRES_LEGAL : esriFieldTypeDouble + ACRES_GIS : esriFieldTypeDouble + VALUE_BLDG : esriFieldTypeDouble + VALUE_LAND : esriFieldTypeDouble + VALUE_TOTAL : esriFieldTypeDouble + TAX08 : esriFieldTypeDouble + TAX_DESC : esriFieldTypeString (15) + Status :PropStatus = Own + DATE_PURCHASED : esriFieldTypeDate + DATE_SOLD : esriFieldTypeDate + DEED : esriFieldTypeString (100)*Link* + TAXRATE : esriFieldTypeDouble + NAME : esriFieldTypeString (50) + ZONING : esriFieldTypeString (30) + USE_LEASE :Yes/No =No + DESCRIPTION : esriFieldTypeString (250) 0101 Absecon 0302 Beverly etc , etc + LASTUPDATE : esriFieldTypeDate Domain : PropStatus Domain : Yes/No Sold Sold Own Own Let Lease Oth Other Y Yes N No
Content Database Population • Start with tax record • Compare to other databases • Normalize data • Locate property in existing parcel layers • Copy into geometry into property layer • If no existing parcel GIS available… • Log into E-Taxmaps.com • Save tax map as .tiff format • Geo-reference • Digitize outline in NJAW layer • Repeat (~500 times)
Context Create Web Application Documents • MSD – Web Optimized Map Document • Operational layers (live) • Thematic layers • Perform spatial analysis as needed • MXD – Normal Map Document • Web edit layer (property) • Cached (tiled) layers • Perform spatial analysis as needed • ArcCatalog – Services • Geometry (measurements) • Geocode (addressing / routing) • Geodata (query)
Context Create A Rich “Base Map” • Create a normal Map Document (mxd) in ArcMap • Design for web viewing… • Cartographic Design • Neutrals? Primaries? Bolds? Muted? Sharp? Soft? Hierarchal? • “Scale Dependencies” • Choose all layers to participate in base map (45+) • Perform Spatial Analysis to create layers as needed • Group according to category • Create additional Group Layers for each scale level (1:25 – 1:2,000,000) • Copy all category group layers into each Scale Group • Create a “Map” for each scale level (17 scales) • Make use of transparencies & label settings • Consider future “live” layer placement (ex: place road labels above roads to make room for water mains) • Set Scale Dependencies for Groups & Layer labels • Test result by zooming in/out at desired Web App zoom levels • Caching Strategy • ‘Extents’ and data / time management • Cache as much as possible without distracting target audience • Thematic or Frequently Updated layers should be a separate “dynamic” service
Raw Data 19
Dynamic Overlay 21
Access Choose the WebApplication Format • ESRI Out – of – Box (GUI) • Drawbacks: - Very limited “looks” - Limited customization of tools • Heavy on server resources • Crashes often • Benefits: - No advanced programming - Wizard driven, simple - Many basics included - Version 9.3.1 has been enhanced • ESRI Server Development Kits (SDK) • .NET, SilverlightTM, FLEXTM, Java, JavascriptTM • Drawbacks: • Some programming • Benefits: • - Change “look” of SDK sample • - Create or change widgets • - Limitless ability to customize tools
Access Configure BasicWeb Application • “Mash Up” various services created earlier • MSD (operational & thematic) • MXD (edit layer) • MXD (cached base map) • MXD (image service) • MXD (cached image hwy labels) • Geo-code (address search service) • Geo-data (query service) • Geometry (drawing service) • Basic configuration of web page “look” • Legend, color, layout, etc
Create & ConfigureApplication Tools Address search Attribute search Attribute query Information tool Live layers widget Print tool Conservation value tool* Canned model results Environmental breakdown tool* % wetlands, urban, etc Spatial query * Live custom location query Editor tool * Real time editing via browser Likely separate application Access • * Optional 24
Simple OOB Draft Web Application
Objective Test & Soft Launch • Tough-book, Office, Laptop • Multiple Browser Test • Edit Testing • Identify Field & Office Soft User Group • Access / Load Testing
Lessons Learned Note: Final project objective different than original conception… Original objective called for an online analysis model for the New Jersey Property database Property GIS layer did not exist No good online ‘housing’ for such a tool Objective re-worked to prepare data & application for future modular enhancements Difficult to find similar proprietary solutions Industry specific cartography sets this application apart from its peers Online cartographic production is time consuming Web mapping applications have a lot of moving parts End users always ask for more, learn to say “no” politely 30
Public User Applications • Collection of related public user sites developed w/ ArcGIS Server: • http://www.esri.com/software/arcgis/arcgisserver/live-user-sites.html • Relevant Selection: • http://gis.hudson.oh.us/SewerTV/ This application was selected for utility relevance. It appears to be written in JavaScript. Tools are ‘soft’, almost cartoonish, making them a bit less intimidating and confusing than the flashy ‘zippy’ Flex tool design. Design is minimalist, but excellent. Choice of cache v. live layers well done. Especially like ability to ‘slide’ through transparency from plain base map to (cached) satellite base map. There are too many cache levels. Application benefits from small extent. The map is cached to a very large scale, however, it is still easy to “trip up” the base map (cache) generation. This seems to be an ArcGIS Server bug, but it might be related to local server RAM or bandwidth. • http://paarcgis.ocpafl.org/Webmap2/default.aspx The Orange County, FL Property Appraiser page is one of the most lauded and one of the earlier ArcGIS Server (9.2) pages to be developed. It is highly polished, with a lot of custom development, and highly geared toward property appraisal. The tourist style map is appropriate for a large public audience, but it transitions to a well designed cadastral map at larger scales. • http://maps.roktech.net/santarosa/ags/zoning/ Compare the Santa Rosa County, FL application to Orange County, and it is night and day. The benefits of well thought out design and cartography become clear. There are successes, however, in this application that are of interest. The clean design, inclusion of ‘canned’ thematic layers, and parcel search tool are all features the NJAW project should aim to emulate. • http://gweb.wra.gov.tw/wrweb/gisindex.htm • http://citymaps10.phila.gov/ZoningOverlay/ • http://ch-arcims.ci.lenexa.ks.us/commdev/communitydevelopmentmap.html
References • Best Practices for Creating an ArcGIS Server Web Application for Municipal / Local Government. http://www.esri.com/library/whitepapers/pdfs/creating-arcgisserver-web-mapping.pdf Accessed November 2009. • ESRI Tax Parcel Template Poster. http://resources.esri.com/landrecords/index.cfm?fa=codeGalleryDetails&scriptID=16559. Accessed December 2009 • Fowler, Martin. (2004). UML Distilled. Boston: Addison-Wesley. • Kruchten, Philippe. (2004). The Rational Unified Process An Introduction. Boston: Addison-Wesley. • Meyer, N. V. (2004). GIS and Land Records The ArcGIS Parcel Data Model. Redlands, CA: ESRI Press. • Meeham, Bill (2007). Empowering Electric & Gas Utilities with GIS. Redlands, CA: ESRI Press. • New Jersey Geographic Network. https://njgin.state.nj.us/NJ_NJGINExplorer/IW.jsp. Accessed December, 2009. • NJAW Water Network Data Model. NJAW_Water_Physical.pdf Revised 9.20.07. Internal Document. New Jersey American Water • Rayburn, S. R. (2004). The Use of GIS in Water Utility Asset Management, Four Seasons Subdivision of Lufkin, Texas. Thesis (M.I.S.)--Stephen F. Austin State University, August, 2004.