Download
1 / 35
350 likes | 494 Views
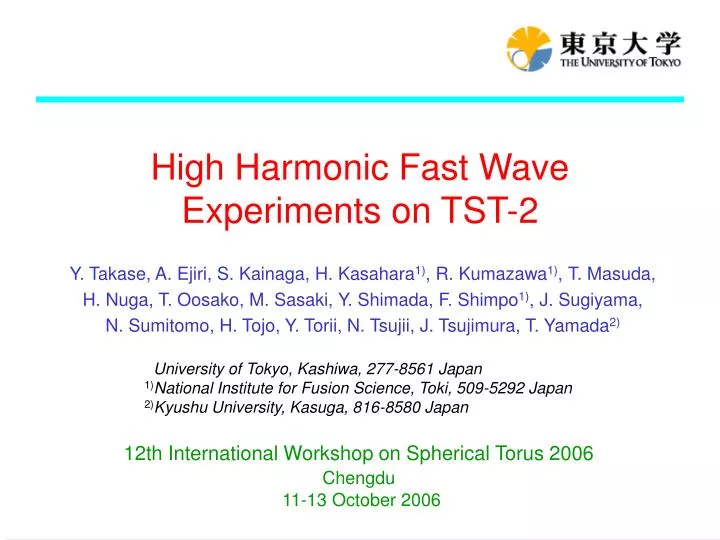
High Harmonic Fast Wave Experiments on TST-2. Y. Takase, A. Ejiri, S. Kainaga, H. Kasahara 1) , R. Kumazawa 1) , T. Masuda, H. Nuga, T. Oosako, M. Sasaki, Y. Shimada, F. Shimpo 1) , J. Sugiyama, N. Sumitomo, H. Tojo, Y. Torii, N. Tsujii, J. Tsujimura, T. Yamada 2).

E N D
High Harmonic Fast Wave Experiments on TST-2 Y. Takase, A. Ejiri, S. Kainaga, H. Kasahara1), R. Kumazawa1), T. Masuda, H. Nuga, T. Oosako, M. Sasaki, Y. Shimada, F. Shimpo1), J. Sugiyama, N. Sumitomo, H. Tojo, Y. Torii, N. Tsujii, J. Tsujimura, T. Yamada2) University of Tokyo, Kashiwa, 277-8561 Japan 1)National Institute for Fusion Science, Toki, 509-5292 Japan 2)Kyushu University, Kasuga, 816-8580 Japan 12th International Workshop on Spherical Torus 2006 Chengdu 11-13 October 2006
Outline • TST-2 spherical tokamak and RF system • HHFW experiment • Electron heating experiment • Wave diagnostics • RF magnetic probes • Reflectometry • Wave measurements • parametric decay • scattering • TORIC full-wave analysis • EC start-up experiment • Plans • 200MHz experiments on TST-2 • RF sustainment of high b plasmas in UTST
HHFW ECH TST-2 Spherical Tokamak R / a = 0.38 / 0.25 m (A = 1.5) Bt = 0.3 T / Ip = 0.1 MA ECH: 2.45GHz (< 5 kW) HHFW: 21MHz (< 200 kW x 2)
Variable k|| Two-Strap Antenna Mo limiters • RF power • 400 kW • Frequency • f = 13, 21, 30 MHz • (w/WH ~ 7 at BT = 0.2 T, f = 21 MHz) • Toroidal wavenumber • kf = nf/R0 = 11, 16, 26 m-1 • (nf = 4.3, 6, 10) • varied by changing the strap spacing • Faraday shield angle • ~ 30° current straps (0, p) Faraday shield
Single-pass Absorption Calculation • Single-pass absorption is greater for double-strap excitation • Single-pass absorption • increases with ne • increases with Te • decreases with Bt (increases with be ) double-strap
Single-Pass Absorption Improves with be Imag ( k⊥) ELD + TTD ELD + TTD + CROSS ELD ELD + CROSS Bt = 0.15 T ne = 1.0×10¹⁹ m-3 Te = 100 eV nf = 10 single-pass absorption = = 0.18
TORIC Full-Wave Calculations • Analysis of HHFW heating scenarios used on TST-2 is being carried out using the TORIC full-wave code. Bt = 0.2 T, f = 21 MHz, n = 10, ne0 = 2 1019 m-3, Te0 = 0.2 keV Electron absorption: 100%
360 kW RF Ip nel Prad SX (> 200 eV) t (ms) Electron Heating by HHFW R=0.19m • Soft X-ray increased, but density and radiated power did not change electron heating • Strongest response near plasma center High field side R=0.26m R=0.38m 360kW 180kW ~ R0 Center no HHFW R=0.43m PS noise R=0.54m Low field side
single-strap double-strap Edge emission with RF visible-SX emission (A.U.) no RF Single-Strap vs. Double-Strap Excitation • Increases in stored energy and visible-SX emission are greater for double-strap excitation • Consistent with single-pass absorption calculation PNET = 120 kW PNET = 120 kW
Wave diagnostics on TST-2 • RF magnetic probes • Sensitive to electromagnetic component • Plasma edge only • Reflectometry • Sensitive to electrostatic component • Can probe the plasma interior • Both parametric decay instability (PDI) and frequency broadening due to scattering by density fluctuations were observed. • These processes can alter the wavenumber spectrum, and affect both wave propagation and absorption.
RF Magnetic Probes at 14 Toroidal Locations Bz Bf Bf φ=-60° φ=-65° φ=-55° φ=-30° φ=-115° φ=-9° φ=-120° φ=0° 1-turn loop φ=-125° φ=9° φ=30° 2cm φ=55° toroidal direction φ=60° Semi-rigid cable φ=65° φ=155° Core (insulator) Direction of B field to be measured φ=150° φ=145° Slit Top view S.S. enclosure
TST-2 Reflectometer System Gunn 25.85 or 27.44 GHz VCO 6-10GHz scalar horn coaxial waveguide X5 X4 Ep x Bt 5-20mW 24-40GHz 100mW D.C. -3dB cos(fp+wt+fRF) I X10 RF LO Q F.G. Aeiwt DC-500MHz Aeiwt+ip sin(fp+wt+fRF) Digitizer or Oscilloscope <250MHz sampling RF 21MHz eiwt One of three sources is used • Frequency sweepable VCO for profile measurements • Fixed Gunn Osc. (25.85 or 27.44 GHz) for RF measurements
Microwave Reflectometer Mirror Window f200 TST-2 V.V. Mirror TF Coil Horn Antennas
Low power High power Parametric Decay: FW IBW + ICQM RF probe ① probe ② PDI Magnetic field dependence ② Parametric Decay Instability (PDI) Most probable decay process: High Harmonic Fast Wave (HHFW) Ion Bernstein Wave (IBW) + Ion-Cyclotron Quasi-Mode (ICQM) WH at outboard edge Threshold power ~ 20 kW
Comparison of RF Probe and Reflectometer Spectra HHFW 250 kW Reflectometer 25.85 GHz (cosine) 1.8 MHz Reflectometer 25.85 GHz (sine) QM IBW RF Probe (dB/dt) Antenna Limiter, P12 Frequency [MHz] Time [ms]
Comparison of RF Probe and Reflectometer Spectra 0 Reflectometer (cos) -20 P (dB) -40 -60 -80 0 Reflectometer (sin) -20 QM IBW P (dB) -40 -60 -80 noise (Al reflector) 0 RF Magnetic Probes -20 FW ? P (dB) -40 IBW -60 -80 15 0 5 10 20 25 f (MHz)
Rout antenna limiter Dependence on Plasma Position PDI becomes stronger as the plasma outer boundary approaches the antenna
③ ① ② ④ Outboard vs. Inboard Comparison RF probes • Inboard spectrum similar to outboard, but weaker ① ② ③ ④
φ=39° straps φ=21° R=125 R=630mm R=700mm Inboard Side Spectra port10 RF probes • Broadened spectrum is only weakly dependent on vertical position Z = 150mm ① ② Z = 0mm ③ ④ Z = -150mm ① ② midplane Bf ③ ④ midplane Bz
① ② Vacuum Plasma ① ① ② ② Frequency Broadening • Frequency broadening of the pump wave • by the plasma is observed. • Possible processes: • Parametric decay • Scattering by density fluctuations
① 10dB Df (HHFW) ② ④ ③ Density Dependence Varies with Probe Position Preliminary Pump wave power Df (HHFW) Lower sideband power DSX / SX • PDI is generally reduced at high density • Only weak effect on heating nel nel
Summary (HHFW Heatng) • A k|| variable antenna was installed in TST-2, and the RF power capability was increased to 400kW. • Dependence on k|| spectrum (same spectral shape but different k||) will be studied. • Single-pass absorption is expected to change from 10% to 35% when ne0 = 3.01019 m−3 and Bt = 0.3T. • In electron heating experiments, soft X-ray emission increased with RF power. • Stored energy increase was larger for double-strap excitation. • More direct measurement of Te is necessary (TS in preparation). • Analysis of HHFW scenarios used on TST-2 is being carried out using TORIC.
Summary (RF Measurements) • PDI and frequency broadening due to scattering were observed by RF magnetic probes. • The strength of PDI increased as the outer boundary of the plasma approached the antenna. • Density dependence varies with RF probe location. • Parametric decay became weaker at high densities where single-pass absorption is predicted to become stronger. • The effect of parametric decay on plasma heating is not clear. • Initial results of RF wave detection inside the plasma by microwave reflectometry were obtained. • PDI spectrum clearly observed • Differentiation of ES and EM components may be made.
EBW Heating on TST-2@K (2003) D(dW/dt) indicates Pabs/Pin > 50% when ne in front of antenna is steep enough < 200 kW @ 8.2 GHz Thursday: S. Shiraiwa, et al., “Study of EBW Heating on TST-2”
inboard limiter Typical EC Start-up Discharge Previously achieved: 1kA/1kW (2.45GHz) 4kA/100kW (8.2GHz) (a) Bt decreases gradually. (RECH decreases gradually.) (b) IPF is kept constant. (c) PEC is kept constant. (d) Ip increases with time, but disappears when the w = We layer moves out of the vacuum vessel. (up to 0.5 kA produced by 4 kW) (e) ne is almost constant near the cutoff density.
Dependence on power and resonance position Ip increases with PEC, whereas ne saturates around the cutoff density 7 1016 m-3 [NL = (5-6) 1016 m-3]. time inboard limiter Ip depends on the w = We resonance position (RECH).
Mirror ratio PF3 PF2+PF5 PF2 PF1 1m -1m 0.7m 0.1m Dependence on PF Strength and Decay Index • Ip maximizes at a certain field strength. • Highest Ipis achieved with PF2 (medium decay index).
Effect of HHFW Injection 3 cases are compared: ●ECH only ● ECH +HHFW ●ECH turned off during HHFW • Ip responds quickly to HHFW • ne and Prad increase during HHFW • After ECH turn-off, Ip decays and HHFW reflection increases.
1 V^ /V0 (c) (a) (b) 0 -0.4 0 1.2 V||/V0 Single Particle Orbit Analysis • Phase space for confined orbits is large for low A devices. • Orbit-averaged toroidal precession is co-directed for all confined orbits. Confined region in phase space (inside outermost blue boundary) Electron orbits starting from R = 0.38m / Z = 0m +1 (a) circulating (b) co trapped (c) ctr trapped Velocity is normalized by V0=RsWp (Wp is the cyclotron frequency corresponding to Bp) -1 0.1 0.8 m A. Ejiri, et al., to be published.
Driven Current Based on Single Particle Analysis Under a low Te (or high BZ) approximation (VTe << V0), j is given by This current has the same parameter dependence and the same order of magnitude as pressure driven currents The generated field is where DR is the thickness of the EC deposition layer
Comparison with Experiment • Bz dependence agrees qualitatively with experiment. • Dependence on PF curvature is different. • Predicted current for PF3 is negligibly small. Assuming correspondence of Ipmax for PF2 Further assuming estimate for driven Ip is
Conclusions (EC Start-up) • Ip of up to 0.5 kA was obtained by ECH start-up (2.45 GHz / 4 kW) . • Ip increases with the decrease in Bt. • Highest Ip was achieved with PF configuration with medium index and appropriate field strength. • Ip and ne increase with PEC, but ne saturates around the cutoff density. • Ip increased by up to 0.4 kA by addition of HHFW power. • Analytic expressions for generated current were derived based on single particle orbits: • Generated current has a similar form to pressure driven currents. • Self-field generation becomes siginificant at high bp. • The proposed model and experimental results are not inconsistent, but further theoretical and experimental studies are needed.
Preparation in Progress for 200 MHz Experiments TST-2 200 MHz transmitters (from JFT-2M) Full-wave calculation by TASK/WM Eq Combline antenna (GA) Bt = 0.3 T, f = 200 MHz, n = 10, ne = 2 1018 m-3, Te = 0.3 keV
A New Ultra-High b ST Based on Plasma Merging Tokyo UTST TS-3 / TS-4 Formation of ultra-high b ST plasma using plasma merging UTST Merging scenario TST-2 Sustainment using innovative RF methods • HHFW (~ 20 MHz) • LHFW (~ 200 MHz) Friday: Y. Ono, et al., “Initial operation of UTST High-Beta Spherical Tokamak Merging Device”