Download
1 / 23
230 likes | 377 Views
. NORS project (Network Of ground-based Remote Sensing Observation ) Contribution of the CNRS LIDAR team. Maud Pastel, Sophie Godin- Beekmann Latmos CNRS UVSQ , France. Start Nov. 1, 2011 Duration: 33 months. NORS project. Aims:

E N D
NORS project (Network Of ground-basedRemoteSensing Observation ) Contribution of the CNRS LIDAR team Maud Pastel, Sophie Godin-Beekmann Latmos CNRS UVSQ , France NDACC Lidar Working Group, 4-8 Nov 2013, TMF, California
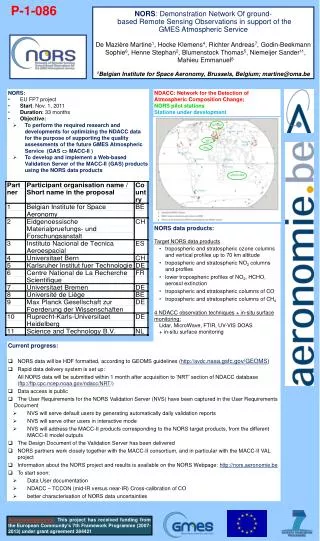
Start Nov. 1, 2011 Duration: 33 months NORS project Aims: • Perform the required research and developments to optimize the NDACC data and data products • Demonstrate the value of ground–based remote sensing data for quality assessment and improvement of the Copernicus Atmospheric Service products CAS (MACC-II as prototype ( Monitoring Atmospheric composition & climate) NORS is a demonstration project • target NORS data products • tropospheric and stratospheric ozone columns and vertical profiles up to 70 km altitude; • tropospheric and stratospheric NO2 columns and profiles; • lower tropospheric profiles of NO2, HCHO, aerosol extinction; • tropospheric and stratospheric columns of CO • tropospheric and stratospheric columns of CH4 • 4 NDACC techniques: LIDAR, MW, FTIR, UV-VIS DOAS and MAXDOAS
NORS project NyAlesund Alpine stations • 4 NDACC pilot stations • Apart from some MAXDOAS data, none of the NORS data are already included in MACC-II VAL. • NORS is complementary to validation included in MACC-II • NORS will aim at consistency with validation protocols and procedures defined in MACC-II (at management level and in VAL subproject) Izaña La Réunion
NORS objectives • Rapid data delivery to NDACC with a delay of maximum 1 month ftp://ftp.cpc.ncep.noaa.gov/ndacc/RD/ • Promote NORS data as validation data for the Copernicus Atmospheric Service products: provide an extensive characterisation of targeted NDACC data and user documentation • Investigate the integration of ground-based data products from various sources (ground-based in-situ surface and remote-sensing data, and satellite data) • Provide ground-based measurement time series back to 2003 in support of the re-analysis products of CAS. • Develop and implement a web-based application for validation of MACCII products using the NORS data products. • Capacity building: • To ‘export’ project achievements to whole NDACC community • To support the extension of NDACC to stations outside Western Europe, namely in the tropics, in China, Latin America, Africa and Eastern Europe
CNRS Contribution: Re–analysed O3 profiles • Define the content : Homegenisation of the O3 LIDAR NDACC data • Use the ISSI (International SpaceScience Institute, Bern) projectrecommendationregardingthe homogeneisation of the characterisation of the LIDAR vertical resolution and uncertainties (lead by Thierry Leblanc) • Use the recommendation of the IGACO –O3 activity: ACSO (Absorption Cross Sections of Ozone) • Define the Temperature et Pressure Model used for the data base. • An extensive characterisation (metadata) of O3 LIDAR data and user documentation canbefound • At http://nors.aeronomie.be • Define the format for the delivery : HDF GEOMS • Location, time and duration provided • O3 number density • Altitude resolution of O3 number density • O3 mixing-ratio profile provided • O3 mixing-ratio profile provided • O3 column provided • Relateduncertainty • LIDAR HDF GEOMS templatecanbefindat • http://avdc.gsfc.nasa.gov/
CNRS Contribution: Delivery • Implementation of procedures for operational delivery of NRT NDACC LIDAR data to the NORS data server with a delay of maximum 1 month after data acquisition Use of a common HDF format compliantwith GEOMS (GenericEarth Observation Metadata Standard) guidelines OHP NRT data available on the NDACC websitefrom 2012 untilnow Delivery of consolidate data from 2003 by the end of the year 2013
CNRS Contribution: Delivery Comparisonbetween MACC II data and NRT lidar profiles
CNRS Contribution: Delivery Comparisonbetwwen MACC II data and NRT lidar partial column Seasonal variation well reproduced by the model MACC II columnlarger than the LIDAR NRT Websiteunder construction, willbe release soon
CNRS Contribution: Integration of ozone products Develop a methodology for integratingground-based data sources and provide consistent ozone vertical distribution time series as well as stratosphericozone columnsat the 4 NDACC stations. NyAlesund Alpine stations Izaña La Réunion 00-
CNRS Contribution: Integration of ozone products Evaluate the validitydomain of ozone profile data Hightlight O3measurementsbiasbetween LIDAR, FTIR and MicroWave • Understandand characterize the origin of thosebiases • statisticaltool for the profiles integration For NyAlesund Izana La Réunion For the alpine station Basic integrationusing MW resolution as reference Neural network approach Resulting profiles O3 (z)= Σ (weq(z)*Werror(z)*correction_bias(z))*O3 stations(z) O3 (z)= Σ(Werror(z)*correction_bias(z))*O3 stations(z)
FTIR Jungfraujoch (47°N, 8°E) Microwaveat Bern (47°N, 7°E) LIDAR at OHP (44°N, 6°E) DIfferentialAbsorptionLidartechniqueforstratosphericozone measurements (GROund-basedMillimeter-waveOzone Spectrometer) (high-resolutionFourier transformInfraRed) • Passive technique • The measurementsperformed over a wide spectral range (around 600– • 4500 cm−1 ) usinghigh-resolutionspectrometersBruker • Active technique • Emission of two laser radiation at wavelengths characterized by a different ozone absorption cross section (308nm and 355 nm) • Passive technique • Measures the ozone transition at 142.175 GHz
Active remotesensing Passive remotesensing Evaluate the validity domain of ozone profile data LIDAR at OHP Microwaveat Bern FTIR Jungfraujoch Retrieved profile isclosed to the apriori profile
Construction of the future databasefrom 2003 untilnow Z The mostlikely Ideal Case The lesslikely 60 km 40 km MW LIDAR FTIR MW FTIR LIDAR FTIR 10 km 5 km
O3monthlymean times series of LIDAR, MW and FTIR profiles (Coincident date) LIDAR LIDAR smoothed MW FTIR Altitude of the maximun O3 lesspronouncedwith MW measurements
Comparison of the times series, MW as reference (Coincident date) LIDAR - MW LIDAR smoothed - MW FTIR- MW • Bias more pronouncedwithunsmoothed LIDAR data • Seasonal variation of the differenceabove 35 km
Origine of biasbetween FTIR and MW = apriori profiles ? Apriori profiles MW winter profile systematicalylowerthan FTIR= origin of the season variation Modification of FTIR apriori profiles (correction of the biasbetween apriori profiles) Correction of FTIR apriori profiles FTIR- MW Before After No more seasonal variation of the differences
0rigin of the biasesbetweeneach stations Origine of the Biasbetween FTIR and MW: instrumental Origine of the Biasbetween OHP and Bern/Jungfrauch : air mass ? Air Mass above OHP and Bern : altitude range ( 325- 950 K) for one dayin January Difference of the origin of the air masse between OHP and Bern for one year OHP-BERN Bern OHP Meandifference Subtropical = 4± 2.3 % Middle Latitude= 1± 3.1% Polar=-6± 2.2% Variation above Bern more pronouncedthan OHP Similar min extrema Max extrema larger ( 10 °) at Bern
Methodology for integrating ground-based ozone profile data • Define altitude levelswhere the differencebetween air mass aboveeach station is the largest. • Define the position (lat/lon) of the new alpine station • and itcorrespondingEquivalent latitude profile • Use a neural network approach on the Equivalent • latitude to assign OHP and Bern weightwhichwill • correspond to the proximity of the new alpine • station’sequivalent latitude. • Attribution of the station weightsateach altitude Alpine station time seriesexpected by the end of 2013
CNRS Contribution: Capacitybuilding • Import automated LIDAR data retrieval at Rio Gallegos (lat : 51.6°S lon : 69.3°W) A scientist from Argentina has been trained to work on the data retrieval Rio Gallegos Site (CEILAP-RG) Province of Santa Cruz, Argentine Patagonia. Promote the achievements of NORS in lidar WG Check !!!
Thankyou For futher informations http://nors.aeronomie.be ftp://ftp.cpc.ncep.noaa.gov/ndacc/RD/
Used of the Self-OrganizingMap(SOM) for the Alpine stations The input parameter = 3D matrix ( lat, lon, Equivalent Latitude) Lat=from 40 to 50 ° Lon=from 0 to 10 ° Exemple for one day in Januaryat 500k Alpine station target= locations ( 45°N, 7 °E) After training the nodemap,the procedureis to place the vectortargetfrom data space onto the mapand find All the nodewith the closest (smallest distance metric) weightvector to the data spacevector. Find OHP and Bern nods and identifiy/retreivedtheirweightvectorfrom the target.
For one dayat 500k Eachneighbouringnode'sweights are adjusted to makethem more like the input vector Assimilation phase 1 nod = 1 configuration Lat Equivalent Latitude Lon Determining the Best MatchingUnit's Local Neighbourhood Calculatethe Euclidean distance betweeneachnode'sweightvector and the targetvector