Download
1 / 25
250 likes | 484 Views
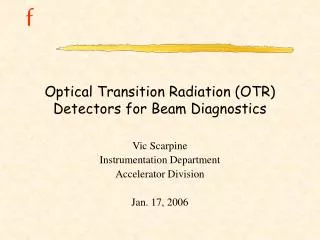
Measurements of Intense Proton Beams using Optical Transition Radiation. Vic Scarpine, Fermilab TIPP 2011 Chicago, IL June 10, 2011. Transverse Beam Profile Methods for Protons. Invasive: Wires Single scanning wire – multi-pulse profiling

E N D
Measurements of Intense Proton Beams using Optical Transition Radiation Vic Scarpine, Fermilab TIPP 2011 Chicago, IL June 10, 2011
Transverse Beam Profile Methods for Protons Invasive: • Wires • Single scanning wire – multi-pulse profiling • Multi-wire – Single pulse profiling but more beam loss • Survival? Non-invasive: • IPM – Ionization Profile Monitor – can be single pulse; expensive • Electron Wire – can be single pulse; expensive • Beam Fluorescence – similar to IPM but usually multi-pulse Another possible invasive method is Optical Transition Radiation (OTR) • Why consider it? V. Scarpine - Fermilab
Optical Transition Radiation OTR is generated when a charged-particle beam transits the interface of two media with different dielectric constants • Surface phenomena OTR detectors are primary beam instruments for electron machines • Far-field and Near-field imaging A number of labs using OTR for proton profiling • CERN, JPARC Fermilab has developed a generic OTR detector for proton and antiproton beams Near-field imaging Far-field imaging V. Scarpine - Fermilab
Proton/Pbar OTR Detectors at FNAL Fermilab Accelerator Complex • Linac • Booster • Main Injector • Tevatron • Pbar Production • NuMI V. Scarpine - Fermilab
Proton/Pbar OTR Detectors at FNAL TeV OTR • Next to IPM • 150 GeV Proton & Pbar Injections V. Scarpine - Fermilab
Proton/Pbar OTR Detectors at FNAL TeV OTR • Next to IPM • 150 GeV Proton & Pbar Injections A150 OTR • 150 GeV Pbars • Emittance V. Scarpine - Fermilab
Proton/Pbar OTR Detectors at FNAL TeV OTR • Next to IPM • 150 GeV Proton & Pbar Injections A150 OTR • 150 GeV Pbars • Emittance AP1 OTR • Up to 8e12 120 GeV protons at ~0.5 Hz V. Scarpine - Fermilab
Proton/Pbar OTR Detectors at FNAL TeV OTR • Next to IPM • 150 GeV Proton & Pbar Injections A150 OTR • 150 GeV Pbars • Emittance AP1 OTR • Up to 8e12 120 GeV protons at ~0.5 Hz NuMI OTR • Up to ~4e13 120 GeV protons at ~0.5 Hz V. Scarpine - Fermilab
Diagram of Generic OTR Detector • Radiation hardened CID camera • ~130 mm pixels at foil • Near field/far field focusing • Tiltable camera to maintain focus across foil (Scheimpflug condition) • Neutral density filter wheels with polarizers • ~x1000 intensity range • Bidirectional beam measurements with selectable foils • 5 to 6 mm aluminized Mylar or Kapton foils • Foils replaceable in-situ • 85 mm clear aperture • Vacuum certified to few 10-9 V. Scarpine - Fermilab
NuMI OTR Detector • OTR detector just in front of shield wall • Next to target SEM profile monitor • 6 mm aluminized Kapton • ~1200 angstroms of aluminum • Two foil design • Primary and Secondary foils • Primary foil : ~6.5e19 protons • Near-field and far-field imaging • Measure beam shape for every pulse • Operating at ~2e13 to 4e13 120 GeV protons per pulse at ~0.5 Hz • Beam size s ~ 1 mm • Up to 350 kW beam power OTR SEM V. Scarpine - Fermilab
NuMI OTR Commissioning Real-time pulse-by-pulse OTR data analysis Gaussian fits to profiles -> centroid, sigma, intensity, 2D tilt, ellipticity Auto-saving every 1000th beam OTR image -> tracking foil lifetime Front-End Controls Display V. Scarpine - Fermilab
Image Processing Three interlaced images Sum = I1 + I2 – 2*I3 • Camera is asynchronous to beam arrival • Use three images to reconstruct beam image • Filter image to remove noise Filtered Image V. Scarpine - Fermilab
Apply Image Calibration • Fiducial holes in foil give: • Scale • Orientation • Perspective correction V. Scarpine - Fermilab
Images Over Intensity Beam intensities of 2.4e13 and 4.1e13 Gaussian fits to beam projections Higher intensity beam has larger ellipticity and beam tilt This show an advantage of a 2-D imaging device over 1-D profile monitors V. Scarpine - Fermilab
Beam Centroids, OTR vs SEM • Monitor OTR and SEM over many days • Compare X and Y beam centroid shapes • OTR and SEM give similar beam centroid positions High Intensity Beam High Intensity Beam V. Scarpine - Fermilab
Beam s, OTR vs SEM sy sx • Detectors track each other • but… • calibration error? • aging foil? V. Scarpine - Fermilab
Foils Damage Under Intense Beams Vacuum Windows OTR Foil Any darkening of foil or distortion of foil shape changes OTR distribution and intensity and hence the measurement of beam shape The left photograph is of a 3 mil thick titanium vacuum window exposed to over 1020 120 GeV protons. The center photograph is a similar vacuum window exposed to ~3x10¹⁸ 120 GeV protons but with a smaller beam spot size. The right photograph is of our prototype OTR 20 mm aluminum foil exposed to ~1019 120 GeV protons with a larger beam spot size. V. Scarpine - Fermilab
Is NuMI Foil Changing with Time? Compare horizontal values of s from OTR and SEM over ~80 day time period from primary foil OTR s appears to be slowly drifting away from SEM s value Is the OTR primary foil aging? V. Scarpine - Fermilab
Primary Foil Aging? Operate primary foil ~3 months of continuous beam ~6.5e19 protons Insert secondary foil under similar beam conditions Secondary foil generating ~25% more OTR Is aluminized Kapton sputtering away? V. Scarpine - Fermilab
Damage to NuMI Aluminized Kapton Foil Aluminum Side Kapton Side ~ 6.5e19 120 GeV protons V. Scarpine - Fermilab
Forward OTR Detector • Utilize target vacuum window as OTR generator • Eliminate reflection of material • Less light collected than reverse OTR • Compensate with amplified camera V. Scarpine - Fermilab
Conclusion • NuMI OTR has operated for ~6.5e19 protons • Beam position and s measured for every pulse • Primary 6 mm aluminized Kapton foil shows aging • Data shows aging effects • Foil show reflection changes and mechanical distortion • Switch to forward OTR detection • Utilize vacuum window as OTR generator • Eliminate reflection effect • Limited light collection V. Scarpine - Fermilab
extra V. Scarpine - Fermilab
Beam Centroid vs Intensity X and Y beam centroid changes slightly with beam intensity Note: difference in OTR and SEM mean position due to difference in (0,0) reference points. V. Scarpine - Fermilab
Beam s vs Intensity OTR and SEM track each other with intensity but OTR has more scatter. Improvements in image processing may reduce scatter. V. Scarpine - Fermilab