Download
1 / 49
500 likes | 673 Views
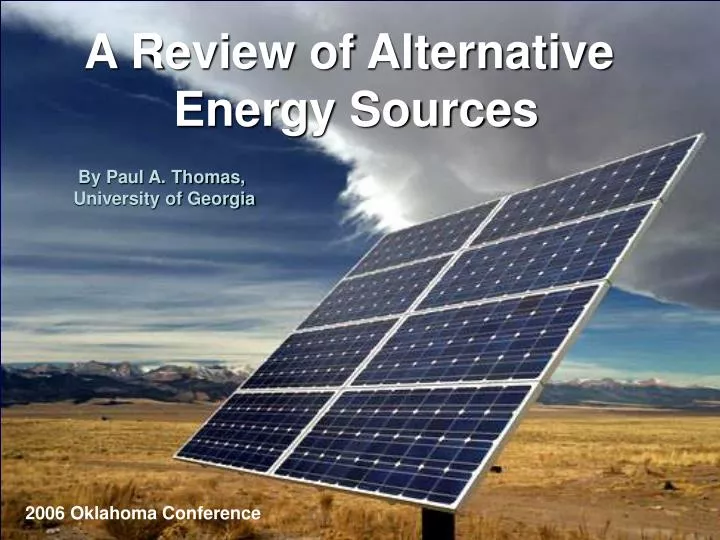
A Review of Alternative Energy Sources. By Paul A. Thomas, University of Georgia. 2006 Oklahoma Conference. Global Warming Data. The Historical Warming Trend?. Maybe Our Sun Controls Things?. Divisions of Sources of Energy. Non-Renewable. Chemical Fossil fuels (Combustion) Nuclear

E N D
A Review of Alternative Energy Sources By Paul A. Thomas, University of Georgia 2006 Oklahoma Conference
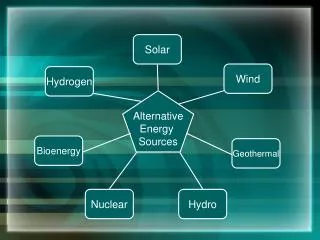
Divisions of Sources of Energy Non-Renewable • Chemical • Fossil fuels (Combustion) • Nuclear • Uranium (Fission of atoms) SUN Renewable • Chemical • Muscular (Oxidization) • Nuclear • Geothermal (Conversion) • Fusion (Fusion of hydrogen) • Gravity • Tidal, hydraulic (Kinetic) • Indirect Solar • Biomass (Photosynthesis) • Wind (Pressure differences) • Direct Solar • Photovoltaic cell (Conversion) Energy
Natural Gas and Depletion • May deplete faster than oil!! – a different pattern • U.S. and Canada have huge supplies – but are using it quickly • The Future of the Oil and Gas Industry: Past Approaches, New Challenges, Harry J. Longwell, 3 Director and Executive VP, Exxon Mobil Corporation, World Energy Vol. 5 No. # 2002
World Oil Production and Estimated Resources, 1900-2100 (in billions of barrels)
Investment is Down! Venture Capital Activity Source: NVCA Yearbook 2004
Gasoline Prices, 1978-1999 Selected Countries (1998 dollars per gallon) U.S.
Russia $0.95 W. Europe $5.25 Ukraine $1.70 U. S. $9.30 China $4.00-5.00 N. Africa $0.80 Trinidad $1.60 Middle East $0.75-1.00 Venezuela $0.90 Indonesia $2.70 Argentina $1.50 The U.S. now has highest natural gas prices in the world ! World Natural Gas Costs $U.S. / MMbtu
Heating Oil Is Also Volatile Current Price $1.98/gal
Problems With Coal • Pollution/Ash • Handling (weight) • Burner maintenance • Availability
World Fossil Fuel Consumption, 1950-1998 (in million of tons of equivalent oil)
Global Energy Systems Transition, (% of Market) 100 Wood Solids Coal 80 Gases 60 Percent Hydrogen 40 Liquids Oil 20 Natural Gas 0 2000 2050 2100 2150 1850 1900 1950 This is what the Gas (hydrogen) Marketers Think!
Energy supply, exajoules 1500 Fuel Cell? Geo/Ocean/Tidal Solar -Photvoltaics 1000 New biomass Wind Nuclear 500 Hydro Gas Oil & NGLs Coal 0 Wood 1860 1900 1940 1980 2020 2060 Source: Royal Dutch Shell Group STRONG GROWTH: CHANGING PATTERN _____________________________________
World Growth of Alternative Energy Will Come Primarily In Developing Countries Source: EIA, International Energy Outlook, 2004
Renewable/Alternative Sources of Energy Fuel Cells Solar Biodiesel Production
Bio-Fuels • Outstanding potential when the price becomes competitive, and they may allow local availability to overcome (temporary) national fuel shortages! • Some adjustments may be needed for certain boilers, and oil burners. • Some potential exists for energy diversification in greenhouses and in transportation.
Bio Fuel - Ethanol The process is currently very energy expensive and very inefficient ……....but someday soon…..…
Applications and delivery issues are being worked out
Hydrogen Fuel Cells • They do work! • Not available or cost effective • Application issues – limited • Hard to find and handle pure hydrogen H2
Ethanol Fuel Cells A more practical source of Hydrogen, but still not cost effective!
Heating With Wood Supply? Labor? Ash? Storage Problems?
Biomass Fuel Forest Wood Residues Agricultural Residues Energy Targeted Crops Thinning residues Wood chips Urban wood waste Woodpallets Yard trimmings Corn stover Rice hulls Sugarcane Animal bio-solids Hybrid poplar Switchgrass Willow Peanut Hulls
GOOD! Moderate
Source: Cogeneration and On-site Power Production July 2003 Jeremy Hugues
Warm Springs
Active Passive Types of Solar Power: Thermal
Photovoltaic More On Solar Power Later!
Wind Power Has Great Potential (Not to scale)
There Are Choices! Large Turbines • Require ~ Class 3-4 Wind Regime • Prefer Class 5 Large Turbines • ~ $1,000 / kW • High Voltage Delivery • Value of Power: 2-5¢ Small Turbines • ~ $2 – 3,000 / kW • Low Voltage Delivery • Value of Power: Small Turbines • Require ~ Class 2 Wind Regime 6-18¢
Geothermal Energy • Water heated by underground magmatic activity is pumped to surface and used for heating or electricity generation • Used in Iceland, Italy, California
Renewable Energy Cost Trends Levelized cents/kWh in constant $20001 4030 20 10 0 100 80 60 40 20 0 PV Wind COE cents/kWh 1980 1990 2000 2010 2020 1980 1990 2000 2010 2020 70 60 50 40 30 20 100 1512 9 6 30 10 8 6 4 20 Solar thermal Biomass Geothermal COE cents/kWh 1980 1990 2000 2010 2020 1980 1990 2000 2010 2020 1980 1990 2000 2010 2020 Source: NREL Energy Analysis Office (www.nrel.gov/analysis/docs/cost_curves_2002.ppt) 1These graphs are reflections of historical cost trends NOT precise annual historical data. Updated: October 2002