Download
1 / 48
500 likes | 581 Views
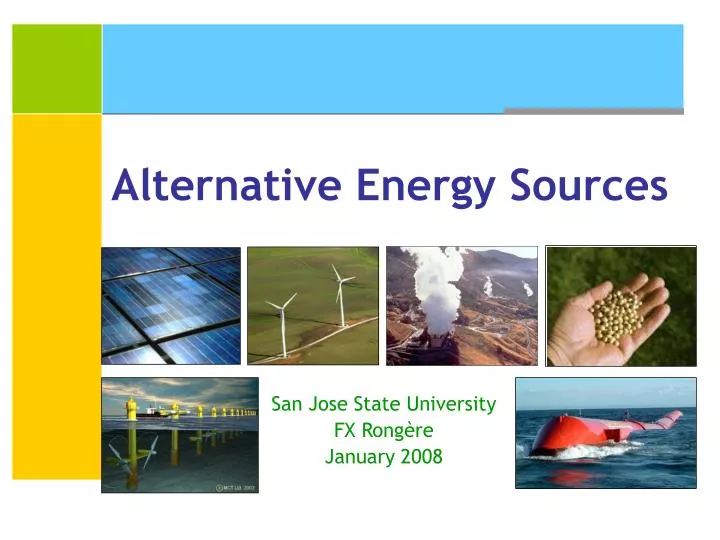
Alternative Energy Sources. San Jose State University FX Rongère January 2008. Introduction The Time is now. San Jose State University FX Rongère January 2008. Renewable Energies: the Time is now. What has changed? Global Warming China and emerging countries Technology

E N D
Alternative Energy Sources San Jose State University FX Rongère January 2008
IntroductionThe Time is now San Jose State University FX Rongère January 2008
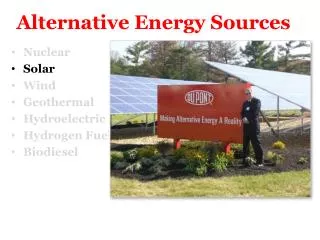
Renewable Energies: the Time is now • What has changed? • Global Warming • China and emerging countries • Technology • Risk Management • Oil and Natural Gas tensions • Renewable Energies in power mix Stronger driver Weaker driver
Global Warming • A wise assumption Wikipedia.org http://en.wikipedia.org/wiki/Image:Instrumental_Temperature_Record.png Dan Cayan ETCC Summit 2007 luncheon_cayan.pdf
Global Warming Evidences • Glacier retreat: 1973 2006 Whitechuck Glacier in North Cascades National Park has retreated 1.2 miles since 1973
Global warming impact in California Source: CEC 500-2006-077
Global warming impact in California • Potential impact in California Source: CEC 500-2006-077 Dan Cayan ETCC Summit 2007 luncheon_cayan.pdf
Other, 8.4% Ag & Forestry, 8.0% Transportation, 41.2% Electric Power, 19.6% Industrial, 22.8% Global Warming • Sector contributions in the USA
2. China and Emerging Countries China is building 2 large power plants per week
$ 25,000 GDP/c/y $ 50,000 GDP/c/y $ 12,500 GDP/c/y China and emerging countries • Carbon intensity of developed economies Intensity (Tons of CO2 per 1,000 US$ ) Source: CEC
$ 12,500 GDP/c/y China passed the USA for CO2 emissions in 2006 with 6,200 MM Tons/year China (2007) China and emerging countries • Carbon intensity of India and China Intensity (Tons of CO2 per 1,000 US$ )
China and Emerging Countries • Most of the CO2 emission increase is due to developing countries
Carbon foot print • Action is required
Technologies • Major technology improvements
Wind turbines • Bigger is better
Technologies • Solar cells: efficiency is everything
Peakers High investment cost - High operation cost Base line Time of operation per year Risk Management • Electricity generation has moved from optimization to risk management Traditional portfolio
Risk Management • Typical cost variability Gas Coal Hydro Nuclear Operation cost ($/kWh) Wind Solar Investment cost ($/kW)
5. Oil & Gas Tensions From: www.dfo-mpo.gc.ca/oceans-habitat/oceans/oap-pao/img/hudsonrig.jpg
Oil and Gas Tensions • Oil Price January 3rd, 2008 Oil Price $100.05 1 barrel = 42 Gallons
Oil and Gas Tensions • Dollar currency change
Oil and Gas Tensions • Crude oil peak
Crude Oil Peak Non OPEC countries
Oil and Gas Tension • Independence and security
Oil and Gas Tensions • Natural Gas Price Volatility
Renewable in Energy mix • Electricity generation in the world
Power Generation in the USA USA Power Generation U.S. Power Plants The size of each circle represents the quantity of emissions in 2002 24 million tons 15 million tons 4 million tons CoalGasOil Source: MJ Bradley and Associates
California Energy Mix • California Gross System Power for 2006 (GWh) Source: CEC http://www.energy.ca.gov/electricity/gross_system_power.html
Energy mix today • Emerging Countries China India
Renewable Portfolio Standards • 28 states have RPS *Four states, Illinois, Missouri, Virginia, and Vermont, have set voluntary goals for adopting renewable energy instead of portfolio standards with binding targets.
Renewable Portfolio Standard Source: http://www.eere.energy.gov/states/maps/renewable_portfolio_states.cfm#map
Fast growing Renewable Energy Sector • Wind is booming in the USA
Fast growing Renewable Energy Sector Total 16,819 MW As 12/31/07 Source: awea 2007 1999
Renewable Energy: the Time is now • “The use of vegetables oils for engine fuels may seem insignificant today but such oils may become in the course of the time as important as the petroleum and the coal tar products of the present time” • “The fuel of the future is going to come from fruit like sumac out by the road, or from apples, weeds, sawdust-almost everything” • “I’d put my money on the sun and solar energy. What a source of power! I hope we don’t have to wait until oil and coal run out before we tackle that” Rudolph Diesel 1912 Henry Ford 1925 Thomas Edison 1931
References • “Our Changing Climate – Assessing the risk for California”, CEC-500-2006-077 July 2006 • www.awea.org • www.ethanolrfa.org • www.nbb.org • “2006 Net System Power Report”, CEC-300-2007-007 April 2007 • http://www.eia.doe.gov/