Download
1 / 1
10 likes | 75 Views
Duration of Herd Participation in Dairy Herd Improvement Milk Recording in the United States E. Hare, * H.D. Norman, and J.R. Wright Animal Improvement Programs Laboratory, Agricultural Research Service, USDA, Beltsville, MD 20705-2350. INTRODUCTION

E N D
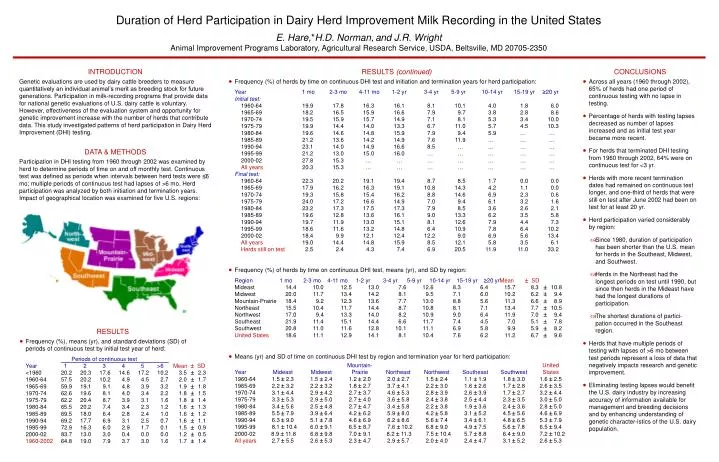
Duration of Herd Participation in Dairy Herd Improvement Milk Recording in the United States E. Hare,*H.D. Norman,and J.R. Wright Animal Improvement Programs Laboratory, Agricultural Research Service, USDA, Beltsville, MD 20705-2350 INTRODUCTION Genetic evaluations are used by dairy cattle breeders to measure quantitatively an individual animal’s merit as breeding stock for future generations. Participation in milk-recording programs that provide data for national genetic evaluations of U.S. dairy cattle is voluntary. However, effectiveness of the evaluation system and opportunity for genetic improvement increase with the number of herds that contribute data. This study investigated patterns of herd participation in Dairy Herd Improvement (DHI) testing. RESULTS (continued) Frequency (%) of herds by time on continuous DHI test and initiation and termination years for herd participation: Year 1 mo 2-3 mo 4-11 mo 1-2 yr 3-4 yr 5-9 yr 10-14 yr 15-19 yr 20 yr Initial test: 1960-64 19.9 17.8 16.3 16.1 8.1 10.1 4.0 1.8 6.0 1965-69 18.2 16.5 15.9 16.6 7.9 9.7 3.8 2.8 8.6 1970-74 19.5 15.9 15.7 14.9 7.1 8.1 5.3 3.4 10.0 1975-79 19.9 14.4 14.0 13.3 6.7 11.0 5.7 4.5 10.3 1980-84 19.6 14.6 14.8 15.9 7.9 9.4 5.9 … … 1985-89 21.2 13.6 14.2 14.9 7.6 11.9 … … … 1990-94 23.1 14.0 14.9 16.6 8.5 … … … … 1995-99 21.2 13.0 15.0 16.0 … … … … … 2000-02 27.8 15.3 … … … … … … … All years 20.3 15.3 … … … … … … … Final test: 1960-64 22.3 20.2 19.1 19.4 8.7 8.5 1.7 0.0 0.0 1965-69 17.9 16.2 16.3 19.1 10.8 14.3 4.2 1.1 0.0 1970-74 19.3 15.8 15.4 16.2 8.8 14.6 6.9 2.3 0.6 1975-79 24.0 17.2 16.6 14.9 7.0 9.4 6.1 3.2 1.6 1980-84 23.2 17.3 17.5 17.3 7.9 8.5 3.6 2.6 2.1 1985-89 19.6 12.8 13.6 16.1 9.0 13.3 6.2 3.5 5.8 1990-94 19.7 11.9 13.0 15.1 8.1 12.6 7.9 4.4 7.3 1995-99 18.6 11.6 13.2 14.8 6.4 10.9 7.8 6.4 10.2 2000-02 18.4 9.9 12.1 12.4 12.2 9.0 6.9 5.6 13.4 All years 19.0 14.4 14.8 15.9 8.5 12.1 5.8 3.5 6.1 Herds still on test 2.5 2.4 4.3 7.4 6.9 20.5 11.9 11.0 33.2 CONCLUSIONS • Across all years (1960 through 2002), 65% of herds had one period of continuous testing with no lapse in testing. • Percentage of herds with testing lapses decreased as number of lapses increased and as initial test year became more recent. • For herds that terminated DHI testing from 1960 through 2002, 64% were on continuous test for <3 yr. • Herds with more recent termination dates had remained on continuous test longer, and one-third of herds that were still on test after June 2002 had been on test for at least 20 yr. • Herd participation varied considerably by region: • Since 1980, duration of participation has been shorter than the U.S. mean for herds in the Southeast, Midwest, and Southwest. • Herds in the Northeast had the longest periods on test until 1990, but since then herds in the Mideast have had the longest durations of participation. • The shortest durations of partici-pation occurred in the Southeast region. • Herds that have multiple periods of testing with lapses of >6 mo between test periods represent a loss of data that negatively impacts research and genetic improvement. • Eliminating testing lapses would benefit the U.S. dairy industry by increasing accuracy of information available for management and breeding decisions and by enhancing understanding of genetic character-istics of the U.S. dairy population. DATA & METHODS Participation in DHI testing from 1960 through 2002 was examined by herd to determine periods of time on and off monthly test. Continuous test was defined as periods when intervals between herd tests were 6 mo; multiple periods of continuous test had lapses of >6 mo. Herd participation was analyzed by both initiation and termination years. Impact of geographical location was examined for five U.S. regions: Frequency (%) of herds by time on continuous DHI test, means (yr), and SD by region: Region 1 mo 2-3 mo 4-11 mo 1-2 yr 3-4 yr 5-9 yr 10-14 yr 15-19 yr 20 yr Mean SD Mideast 14.4 10.0 12.5 13.0 7.6 12.6 8.3 6.4 15.7 8.3 10.8 Midwest 20.0 11.7 13.4 14.2 8.1 9.5 7.1 6.0 10.2 6.2 9.4 Mountain-Prairie 18.4 9.2 12.3 13.6 7.7 13.0 8.8 5.6 11.3 6.6 8.9 Northeast 15.5 10.4 11.7 14.4 8.7 10.8 8.1 7.1 13.4 7.7 10.5 Northwest 17.0 9.4 13.3 14.0 8.2 10.9 9.0 6.4 11.9 7.0 9.4 Southeast 21.9 11.4 15.1 14.4 6.6 11.7 7.4 4.5 7.0 5.1 7.8 Southwest 20.8 11.0 11.6 12.8 10.1 11.1 6.9 5.8 9.9 5.9 8.2 United States 18.6 11.1 12.9 14.1 8.1 10.4 7.6 6.2 11.2 6.7 9.6 RESULTS Frequency (%), means (yr), and standard deviations (SD) of periods of continuous test by initial test year of herd: Periods of continuous test Year 1 2 3 4 5 >6 Mean SD <1960 20.2 20.3 17.6 14.6 17.2 10.2 3.5 2.3 1960-64 57.5 20.2 10.2 4.9 4.5 2.7 2.0 1.7 1965-69 59.9 19.1 9.1 4.8 3.9 3.2 1.9 1.8 1970-74 62.6 19.6 8.1 4.0 3.4 2.2 1.8 1.5 1975-79 62.2 20.4 8.7 3.9 3.1 1.6 1.8 1.4 1980-84 65.5 20.2 7.4 3.4 2.3 1.2 1.6 1.3 1985-89 69.5 18.0 6.4 2.8 2.4 1.0 1.6 1.2 1990-94 69.2 17.7 6.9 3.1 2.5 0.7 1.6 1.1 1995-99 72.9 16.3 6.0 2.9 1.7 0.1 1.5 0.9 2000-02 83.7 13.0 3.0 0.4 0.0 0.0 1.2 0.5 1960-2002 64.8 19.0 7.9 3.7 3.0 1.6 1.7 1.4 Means (yr) and SD of time on continuous DHI test by region and termination year for herd participation: Mountain- United Year Mideast Midwest Prairie Northeast Northwest Southeast Southwest States 1960-64 1.5 2.3 1.5 2.4 1.2 2.0 2.0 2.7 1.5 2.4 1.1 1.9 1.8 3.0 1.6 2.5 1965-69 2.2 3.2 2.2 3.2 1.8 2.7 3.7 4.1 2.2 3.0 1.6 2.6 1.7 2.8 2.6 3.5 1970-74 3.1 4.4 2.9 4.2 2.7 3.7 4.6 5.3 2.8 3.9 2.6 3.9 1.7 2.7 3.2 4.4 1975-79 3.3 5.3 2.9 5.0 2.7 4.0 3.6 5.8 2.4 3.8 2.5 4.4 2.3 3.5 3.0 5.0 1980-84 3.4 5.6 2.5 4.8 2.7 4.7 3.4 5.8 2.2 3.8 1.9 3.6 2.4 3.6 2.8 5.0 1985-89 5.5 7.9 3.9 6.4 4.2 6.2 5.9 8.0 4.2 5.8 3.1 5.2 4.5 5.6 4.6 6.9 1990-94 6.3 9.0 5.1 7.8 4.6 6.9 6.2 8.6 5.6 7.4 3.4 6.1 4.8 6.5 5.3 7.9 1995-99 8.1 10.4 6.0 9.1 6.5 8.7 7.6 10.2 6.8 9.0 4.9 7.5 5.6 7.8 6.5 9.4 2000-02 8.9 11.8 6.8 9.8 7.0 9.1 8.2 11.3 7.5 10.4 5.7 8.8 6.4 9.0 7.2 10.2 All years 2.7 5.5 2.6 5.3 2.3 4.72.9 5.7 2.0 4.0 2.4 4.7 3.1 5.2 2.6 5.3