Download
1 / 27
270 likes | 400 Views
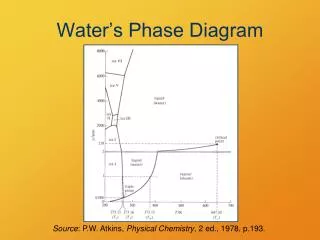
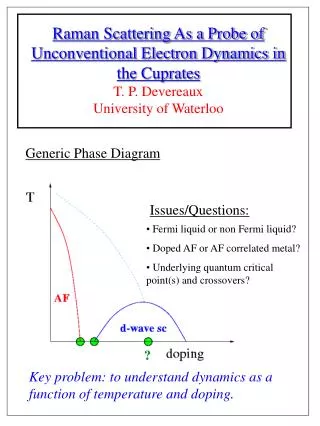
Phase Diagram of a Point Disordered Model Type-II Superconductor. Peter Olsson Stephen Teitel Umeå University University of Rochester. IVW-10 Mumbai, India. What is the equilibrium phase diagram of a strongly fluctuating type-II superconductor?. Experiments:.

E N D
Phase Diagram of a Point Disordered Model Type-II Superconductor Peter Olsson Stephen Teitel Umeå University University of Rochester IVW-10 Mumbai, India
What is the equilibrium phase diagram of a strongly fluctuating type-II superconductor? Experiments: Optimally doped untwinned YBCO Vortex liquid Vortex glass Bragg glass Shiba et al., PRB 2002 Bragg glass -- vortex liquid vortex glass? vortex slush? critical end point? multicritical point? Pal et al., Super. Sci. Tech 2002 point disorder
Phase Diagram Theoretical: Hu and Nonomura, PRL 2001 Kierfeld and Vinokur, PRB 2004 Lindemann criterion XY model simulations
Outline • Introduction • 3D XY model and parameters • thermodynamic observables and order parameters • Low disorder • vortex lattice melting • Large disorder • vortex glass transition • gauge glass and screening • Intermediate disorder • vortex slush? • Conclusions • the phase diagram!
3D Frustrated XY Model kinetic energy of flowing supercurrents on a discretized cubic grid coupling on bond im phase of superconducting wavefunction magnetic vector potential density of magnetic flux quanta = vortex line density piercing plaquette a of the cubic grid uniform magnetic field along z direction magnetic field is quenched constant couplings between xy planes || magnetic field random uncorrelated couplings within xy planes disorder strength p weakly coupled xy planes
or increasing disorder strength p at fixed magnetic field f increasing magnetic field f at fixed disorder strength p Parameters anisotropy system size ~ 80 vortex lines disorder strength varies vortex line density fixed ground state vortex configuration for disorder-free system systematically vary p to go from weak to strong disorder limit exchange Monte Carlo method (parallel tempering)
Thermodynamic observables free energy F b = 1/kBT E - energy density Q - variable conjugate to the disorder strength p E and Q should in general change discontinuously at a 1st order phase transition E and Q must both be continuous at a 2nd order phase transition
or Structure function -vortex lattice ordering parameter nz is vortex density in xy plane real-space K2 K1 vortex liquid or vortex solid ky kx k-space
phase coherent: F[Dm] varies with Dmfree energy sensitive to boundary phase incoherent:F[Dm] independent of Dmfree energy insensitive to boundary twist histogram: measure by simulating in fluctuating twist ensemble evaluate at the twist Dm 0 that minimizes the free energy F, or maximizes the histogram P helicity modulus: (phase stiffness) Helicity Modulus -phase coherence order parameter twisted boundary conditions twist dependent free energy Dm 0 = 0 for a disorder-free system, but not necessarily with disorder p > 0
Low disorder-the vortex lattice melting transition Structure function p = 0.16 T = 0.2210 liquid solid liquid T = 0.1985 solid Structure function indicates vortex solid to liquid transition
twist histograms Helicity modulus p = 0.16 normal superconducting
Plots of DS, U, E, or Q vs. T do not directly indicate the order of the melting transition. Need to look at histograms! vortex lattice ordering parameter DS Bimodal histogram indicates coexisting solid and liquid phases! 1storder melting transition
Use peaks in P(DS) histogram to deconvolve solid configurations from liquid configurations. Construct separate E and Q histograms for each phase to compute the jumps DE and DQ at the melting transition.
Melting phase diagram f = 1/5 As disorder strength p increases, DE decreases to zero, but DQ remains finite. Transition remains 1st order, without weakening, along melting line. P. Olsson and S. Teitel, Phys. Rev. Lett. 87, 137001 (2001)
Large disorder-the vortex glass transition p = 0.40 well above the melting transition line No longer any vortex solid histograms of lattice ordering parameter P(DS) T = 0.90 below Tg T = 0.221 above Tg
Phase coherence Looking for a 2nd order vortex glass transition with critical scaling. In principal, scaling can be anisotropic since magnetic field singles out a particular direction. If anisotropic scaling, situation very difficult; need to simulate many aspect ratios Lz/L^. So assume scaling is isotropic, z = 1, and see if it works! (it does!) Use constant aspect ratio Lz = L^. Curves for different L all cross at t = 0, i.e. T = Tg P. Olsson, Phys. Rev. Lett. 91, 077002 (2003)
Histograms of twist Dmfor a particular realization of disorder p = 0.40 well above the melting transition line twist histogram develops several local maxima as enter the vortex glass phase
Helicity modulusp= 0.30, 0.40, 0.55 averaged over 200 - 600 disorder realizations curves for a particular p cross at single Tg scaling collapse of data
Phase diagram for melting and glass transitions How do glass and melting transitions meet???
uniform random distribution (Katzgraber and Campbell, 2004) vortex glass model: magnetic field breaks isotropy (Olsson, 2003) Vortex glass vs. gauge glass gauge glass model: (Huse & Seung, 1990) gauge glass is intrinsically isotropic - average magnetic field vanishes although vortex glass is not isotropic, critical scaling is isotropic gauge glass and vortex glass are in the same universality class (also, Kawamura, 2003, Lidmar, 2003)
When include magnetic field fluctuations due to a finite l, the gauge glass transition in 3D disappears, Critical scaling will break down when one probes length scales Screening (Kawamura, 2003) (Bokil and Young, 1995, Wengel and Young, 1996) If gauge glass and vortex glass are in the same universality class, expect the same. Vortex glass ‘transition’ will survive only as a cross-over effect. Resistance in vortex glass will be linear at all T, for sufficiently small currents. how small?
Phase diagram for melting and glass transitions How do glass and melting transitions meet??? Simulations get very slow and hard to equilibrate.
Intermediate disorder - still a vortex solid, but now two! p = 0.22 DE and DQ consistent with values from lower p
Phase coherence p = 0.22
snapshot of vortex configurations for 4 successive layers Intermediate solid phase “solid 1” p = 0.22 Intermediate solid consists of coexisting regions of ordered and disordered vortices.
Only the orientation given by K1 is coherent throughtout the thickness of the sample. Orientation K2 may exist locally in individual layers, but without coherence from layer to layer. --- Intermediate solid phase “solid 1” p = 0.22 Some similarities to “vortex slush” of Nonomura and Hu. Does it survive as a distinct phase in larger systems?
Phase diagram of point disordered f = 1/5 3D XY model Conclusions Melting transition remains 1st order even where it meets glass transition Glass transition becomes cross-over on large enough length scales Possible intermediate solid? Needs more investigation Lattice to glass transition at low T?