Download
1 / 14
140 likes | 308 Views
Development of Nutrient Water Quality Standards for Rivers and Streams in Ohio. Ohio EPA ORSANCO, October 20, 2009 George Elmaraghy, P.E., Chief. The Nutrient Conundrum. Define criteria for natural constituents Essentially asking how much is too much

E N D
Development of Nutrient Water Quality Standards for Rivers and Streams in Ohio Ohio EPA ORSANCO, October 20, 2009 George Elmaraghy, P.E., Chief
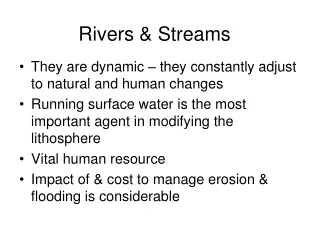
The Nutrient Conundrum • Define criteria for natural constituents • Essentially asking how much is too much • Linear dose-response model used for toxics does not apply • Wide variations • Many cases where nutrients are high but aquatic life is maintained, or the converse • Indirect impacts on aquatic life • Nutrient impacts are not direct, nutrients impact parameters such as D.O. which in turn impact aquatic life • Risk management • Balance margin of safety without being over-protective
Biological Response to Nutrients and Toxic Pollutants Proactive control for threatened waters based on secondary response indicators (i.e., chlorophyll, D.O.) Protect waters currently achieving Routine Monitoring Manage to control over-enrichment Response to Toxic Pollutants (e.g., NH3) EWH Quality of Aquatic Life Response to Nutrient Enrichment with “confidence intervals” WWH Environmental Gradient
Stressor-response approach * • Estimate a relationship between nutrient concentrations and biological response • Relate to designated use (ideally quantitatively) • Derive nutrient concentrations protective of designated uses from the observed relationships * Modified from “Empirical Approaches for Nutrient Criteria Derivation” draft SAB report, 2009
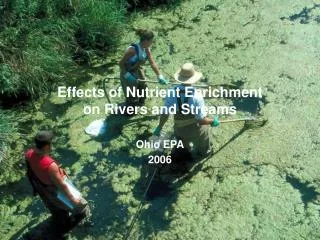
Approach Taken in Ohio • Empirical Approach – field assessments on small streams and rivers up to 500 sq. mi. in drainage • Concurrent chemical and biological measurements • Biology (fish, bugs), direct connection to our designated uses • Habitat (channel width and morphology, canopy) • Benthic algal biomass (Chlorophyll a) • Total inorganic nitrogen • Total Phosphorus • 24-hour dissolved oxygen • 4 years of data
Effects-based Methods for DefiningNutrient Criteria Describe relationship between nutrient concentrations and benthic chlorophyll Describe relationship between benthic chlorophyll and hourly dissolved oxygen Describe relationship between dissolved oxygen and fish or macroinvertebrates Describe relationship between range in 24 hour D.O. and minimum D.O. at concentrations falling below WQS End Result Detected relationships & “break point values” that we can apply in the management of nutrients on a watershed scale • Linear regression • Change-point analysis • Linear regression • Change-point analysis • Linear regression • Change-point analysis • Linear regression
Thresholds in Relationships Between Stressor and Response Variables Define Nutrient Criteria(all streams except nutrient sensitive streams) Nutrients DIN > 1.10 mg/l TP > 0.10 mg/l + Light Canopy > 45o open Benthic Chlorophyll > 194 mg/m2 Aquatic Life Elevated Risk of Impairment 24 h D.O. Range > 7.0 mg/l Minimum D.O. < 5.0 mg/l
Thresholds in Relationships Between Stressor and Response Variables Define Nutrient Criteria(nutrient sensitive streams) Nutrients DIN > 0.44 mg/l TP > 0.04 mg/l + Benthic Chlorophyll > 120 mg/m2 Light Canopy > 45o open Aquatic Life Elevated Risk of Loss of Special Resource 24 h D.O. Range > 6.0 mg/l Minimum D.O. < 6.0 mg/l
Application of Nutrient Criteria – Step 1Confirm an Existing Problem or Threat Is Biology Impaired or only Marginally Attaining? No Yes Step 1a High Nutrients [> 1.10 DIN, > 0.10 TP] Excess of Benthic Algae [> 194 mg/m2] Wide D.O. Swings [> 7.0 mg/l] Nutrient Impairment confirmed [Step 2 – derive NPDES Limit or TMDL]
Application of Nutrient Criteria – Step 1aNutrient Sensitive Streams Is the Stream Nutrient Sensitive? Benthic Algae [< 120 mg/m2] D.O. Swings [< 6.0 mg/l] Minimum D.O. [> 6.0 mg/l] Number of EPT Taxa [>15] Nutrient Sensitive Stream [Step 2 – permit increased N or P loads carefully] No Yes Stop
Application of Nutrient Criteria – Step 2Implement in Management Restore Impaired Waters Protect Existing High Quality Waters < 1.10 mg/l DIN < 0.44 mg/l < 0.10 mg/l TP < 0.04 mg/l Riparian Restoration Light Riparian Protection Specifics on how to implement these criteria are still under development
Biological Response to Nutrients Proactive control for threatened waters based on secondary response indicators (i.e., chlorophyll, D.O.) Protect waters currently achieving Routine Monitoring Manage to control over-enrichment EWH Response to Nutrient Enrichment with “confidence intervals” Quality of Aquatic Life WWH TP ~ 0.10 mg/l TP ~ 0.04 mg/l Environmental Gradient
Schedule • Small streams and rivers (< 500 sq. mi. drainage) • Begin rule making summer 2010 • Complete rule making summer 2011 • Large rivers (> 500 sq. mi. drainage) • additional field work 2010 – 2012 • Complete rule making in 2013
Contact Information Email: george.elmaraghy@epa.state.oh.us Phone: 614-644-2001 Fax: 614-644-2745 DSW Website: http://www.epa.ohio.gov/dsw/