Download
1 / 33
330 likes | 449 Views
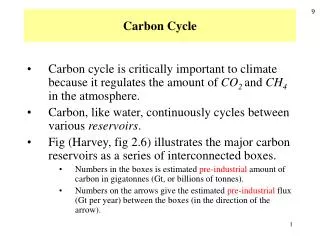
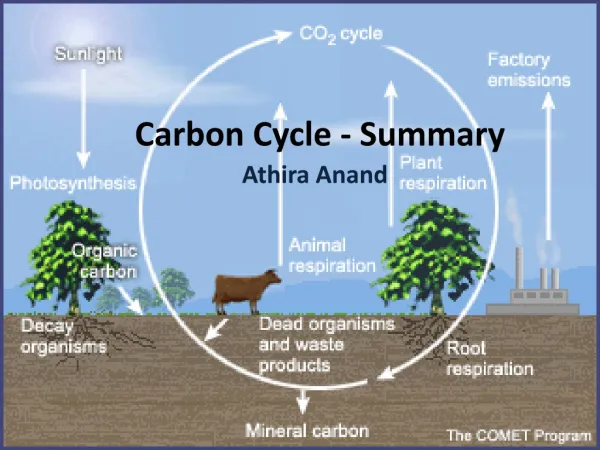
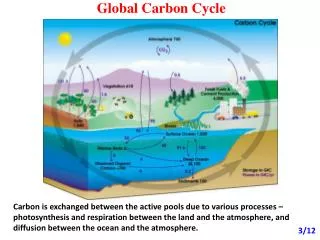
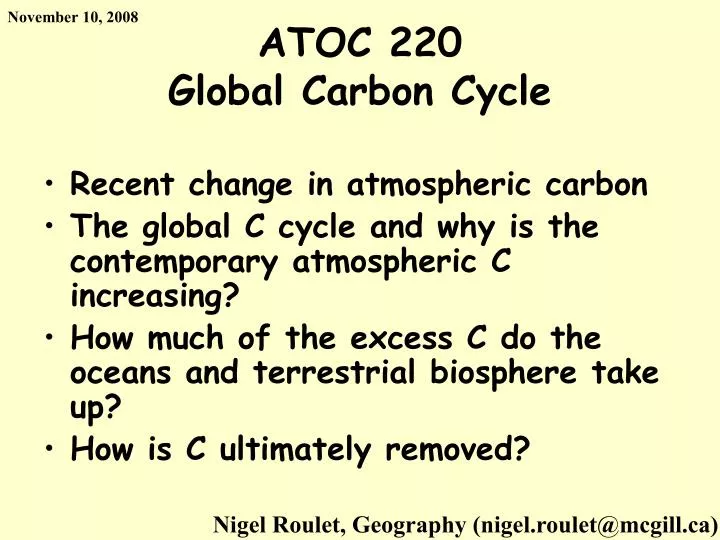
November 10, 2008. ATOC 220 Global Carbon Cycle. Recent change in atmospheric carbon The global C cycle and why is the contemporary atmospheric C increasing? How much of the excess C do the oceans and terrestrial biosphere take up? How is C ultimately removed?.

E N D
November 10, 2008 ATOC 220Global Carbon Cycle • Recent change in atmospheric carbon • The global C cycle and why is the contemporary atmospheric C increasing? • How much of the excess C do the oceans and terrestrial biosphere take up? • How is C ultimately removed? Nigel Roulet, Geography (nigel.roulet@mcgill.ca)
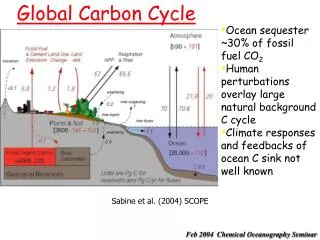
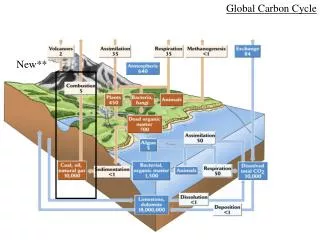
Global Carbon Cycle Sedimentary rock 40,000,000 (CaCO3) Black: pre-industrial Red: + industrial era up to ~1990 (IPCC, 2006)
Historical Land Use Maps (RIVM, Netherlands) Kees Klein Goldewijk (2001)
CO2 source/sink equation 3.2 = -2.2 – 2.6 + 6.4 + 1.6 sink sink source source IPCC 2006 best guess
Perturbation of Global Carbon Budget (1850-2006) 2000-2006 fossil fuel emissions 7.6 Source deforestation 1.5 CO2 flux (Pg C y-1) atmospheric CO2 4.1 Sink land 2.8 ocean 2.2 Time (y) Le Quéré, unpublished; Canadell et al. 2007, PNAS
Fossil Fuel Emissions: Actual vs. IPCC Scenarios 2007 Fossil Fuel: 8.5 Pg C Observed 2000-2007 3.5% Raupach et al 2007, PNAS & Global Carbon Project update (http://www.globalcarbonproject.org/carbontrends/index.htm)
Population Wealth = per capita GDP Carbon intensity of GDP Drivers of Anthropogenic Emissions 1.5 1.5 1.5 World 1.4 1.4 1.4 1.3 1.3 1.3 1.2 1.2 1.2 1.1 1.1 1.1 1 Factor (relative to 1990) 1 1 0.9 0.9 0.9 0.8 0.8 0.8 Emissions F (emissions) P (population) 0.7 0.7 0.7 g = G/P 0.6 0.6 0.6 h = F/G 0.5 0.5 0.5 1980 1985 1990 1995 2000 2005 1980 1980 Raupach et al 2007, PNAS
Why are the oceans and terrestrial ecosystems taking up excess CO2?
1. The marine biological pump atmospheric CO2 Ocean surface Phytoplankton sedimentation of organic C upwelling Bacterial decomposition Nutrients CO2 Deep Ocean
Ocean net primary production NPP g C/m2/yr Global Ocean NPP ~ 50 to 60 Gt C/yr → ~ 11 buried & the rest recycled Living biomass is 3 Gt C it means the residence time of the plankton is a few weeks
2. The solubility pump CO2 Atmosphere Ocean surface CO2+ H2O H2CO3 carbonic acid H2CO3 H+ + HCO3- bicarbonate HCO3- H+ + CO32- carbonate
2. The solubility pump CO2 Atmosphere Ocean surface CO2+ H2O H2CO3 carbonic acid H2CO3 H+ + HCO3- bicarbonate HCO3- H+ + CO32- carbonate
How is this CO2 removed from contact with the atmosphere? Thermohaline circulation
CO2(aq) dissociates rapidly into DIC while increasing acidity: pH K1 K2 CO2 + H2O HCO3- + H+ CO32- + 2H+ bicarbonate carbonate Bjerrum Plot:pH = 8.1T = 250C, S = 35[CO2] : [HCO3-] : [CO3=] 0.5% : 86.5% : 13% => Buffering?? (Zeebe & Wolf-Gladrow, 2002)
Ocean Acidity Observations Model analysis Calderia & Wickett http://royalsociety.org/displaypagedoc.asp?id=13314
The solubility pump & calcium carbonate formation CO2 Atmosphere Ocean surface CO2+ H2O H2CO3 H2CO3 H+ + HCO3- shelled organisms Ca2+ + 2HCO3- CaCO3+ H2CO3
Coccolithophores (algae) • planktonic • produce 1.5 million tons • of CaCO3 per yr • sometimes form “blooms” • at the ocean surface which • reflect visible light SeaWiFS image 16 July 2000
The ‘real’ terrestrial C cycle CO2 ~60 Store ~60 Autotrophic Respiration (AR) Heterotrophic Respiration (HR) Gross primary production (GPP) Time (longer) 600 1700 ~60 ~120 Disturbance ? Net ecosystem production ( > 0) NEP = NPP - HR
Forest Regrowth Pool changes were evaluated as the difference between the late 1990s and early 1980s pool estimates, pixel-by-pixel, and quoted on a per year basis. The carbon pool in the woody biomass of northern forests (1.5 billion ha) is estimated to be 61 20 Gt C during the late 1990s. Our sink estimate for the woody biomass during the 1980s and 1990s is 0.680.34 Gt C/yr. http://cybele.bu.edu/greeningearth/ge.html
Why an increased uptake on land? • Elevated CO2 leading to increased NPP • Evidence suggest this might be only a few percent • Response to increased nitrogen deposition • Evidence indicates that only a small fraction of added N getting into biomass: most is immobilized in soils • Climate change? • Forest regrowth • Most reasonable explanation • Detail inventory studies in the US support this • Remote sensing estimates support increase in biomass
What are the relative importance of the land and oceans in taking up excess CO2? Source Sink Many model inversions using lots of data (K.R. Gurney et al., Nature, 415:626 [2002])
The Efficiency of Natural Sinks: Land and Ocean Fractions Land Relative to annual atmospheric input Ocean Canadell et al. 2007, PNAS
161 Gt C 0.2 Gt C/yr = 805 years Key point It takes a very long time to get the excess carbon out of the atmosphere
Carbon-climate-human System Human System Carbon-climate System Fossil Fuel burning Social Structures and Institutions (+) Atmospheric CO2 Human Actions (+) LUC Systems Energy Systems X WARMING (+) (+) (-) (+) Vulnerability of C pools (+) C emissions IMPACTS - ADAPTATION Vulnerabilities of the Carbon-Climate-Human system (-)