Download
1 / 47
520 likes | 592 Views
The Global Carbon Cycle. Integrating Humans, Climate and the Natural World Island Press – 2004. SCOPE. SCOPE 62. COP9, Milan, Dec.8 th , 2003,Side Event Outline Christopher Field, Carnegie Institution, Stanford, California, cfield@globalecology.stanford.edu

E N D
The Global Carbon Cycle Integrating Humans, Climate and the Natural World Island Press – 2004 SCOPE
SCOPE 62 COP9, Milan, Dec.8th, 2003,Side Event Outline • Christopher Field, Carnegie Institution, Stanford, California, cfield@globalecology.stanford.edu • Dorothee Bakker, University of East Anglia, Norwich, UK, d.bakker@uea.ac.uk • Patricia Romero Lankao, Universidad Autonoma Metripolitana, Mexico City, Mexico, rolp7543@cueyatl.uam.mx • Josep Canadell, CSIRO Land and Water, Canberra Australia, pep.canadell@csiro.au
Land C budget (1980-2000) Net land sink 0.6 Pg y-1 Deforestation 1.2 Pg C y-1 Residual land sink 1.8 Pg C y-1
New Understanding • Inertia • Saturation • Vulnerability • The Energy Gap • A Common Framework
Inertia • Many current sinks a result of past actions • Entrained warming continues for many decades • Key technologies require fundamental development
Inertia 2 • Inertia chart
Vulnerability • On Land: Several large pools poised for large releases in a warming climate • C in permafrost soils • Wildfire • Tropical forests Carbon release Warming
Tropical forests Increased respiration 700 Pg C gain Becomes 100 Pg C loss Decreased growth Warming Increased fire Low to moderate Ocean compensation Extra 350 ppm CO2 in Atm Cox et al. 2000. Nature 408: 184
The Energy Gap • Scenarios contain optimistic efficiency increases • still fail to stabilize below 750 • do not yet account for all sources of vulnerability
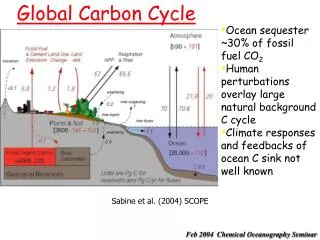
50.0 Chlorophyll a (mg/m3) 10.0 2.0 0.5 0.1 0.01 The oceanic carbon cycle in a changing climate Blue planet: Oceans and seas cover 71 % of the globe(Tchernia, 1980). The oceans store 88% of global carbon outside geological reservoirs (IPCC, 2001). (BBC; 6 years of SeaWiFS data, DAAC/GSFC, ORBIMAGE)
Oceanic uptake of fossil fuel CO2 370 - Hawaii CO2 content (µmol/mol) 350 330 310 - BATS (Bermuda) 1970 2000 2060 Total CO2 (µmol/kg) 2030 2000 1988 1990 1992 1994 1996 1998 (Keeling and Bates)
Oceanic sink for anthropogenic CO2 Based on 40 years of surface pCO2 data (Takahashi et al., 2002) The oceans absorb 27% of the anthropogenic CO2 emissions or 1.7 +/- 0.5 Pg C/yr (IPCC, 2001). Quantification of oceanic CO2 sources/sinks puts a constraint on land sources/sinks.
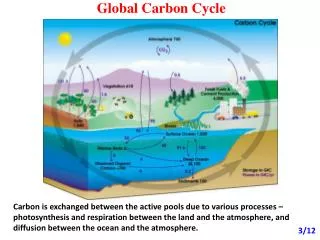
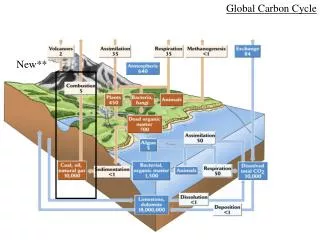
1 CO2 Air-Sea exchange Atmosphere CO2 730 CO2 air-sea flux = - K •(pCO2air - pCO2water) Driving force for oceanic uptake of anthropogenic CO2 CO2 (aq) + H2O H2CO3 Surface Ocean H2CO3 H+ + HCO3- HCO3- H+ + CO32- Total CO2 1020 Shelf ~100 m Deep Ocean Lysocline ~3500 m Sea floor (in Pg C; after IPCC, 2001, Fig. 3.1)
2 Physical pump Atmosphere CO2 730 CO2 (aq) + H2O H2CO3 Surface Ocean H2CO3 H+ + HCO3- HCO3- H+ + CO32- Total CO2 1020 Shelf ~100 m Determines the rate of oceanic uptake of anthropogenic CO2 Deep Ocean Total CO2 38,000 Lysocline ~3500 m Sea floor (in Pg C; after IPCC, 2001, Fig. 3.1)
3 Physical and Biological pump Atmosphere CO2 730 CO2 (aq) + H2O H2CO3 Biota 3 Surface Ocean H2CO3 H+ + HCO3- HCO3- H+ + CO32- Total CO2 1020 Shelf ~100 m Organic matter CaCO3 Deep Ocean <700 Total CO2 38,000 Lysocline ~3500 m Sea floor (in Pg C; after IPCC, 2001, Fig. 3.1)
4 Feedbacks on oceanic CO2 uptake Anthropogenic CO2 uptake Climate change Buffer Capacity Circulation Warming Biology Anthro- pogenic Natural cycle [<20%] [30%] 50% ? 50% ? <3% ? <20% ? CaCO3 CO2 system Organic carbon Surface Ocean Total carbon Shelf ~100 m Deep Ocean Total carbon (in Pg C; after Gruber et al., SCOPE) Sea floor Relative to 600-700 Pg C of cumulative oceanic uptake of anthropogenic CO2 for 2000 - 2100.
A reduction of calcification by oceanic uptake of anthropogenic CO2 Calcifying algae Emiliania huxleyi; A bloom in the English Channel. Brain coral and sea fan, Florida Keys (Greenblatt and Sarmiento, SCOPE book; Jeremy Young, Natural History Museum, London; Steven Cook, Florida Keys National Marine Sanctuary)
Greenland-Denmark New York–Halifax-Hamburg Caribbean – Portsmouth South-America-Spain 90°W 50°W 10°W North Atlantic Carbon Observing System Cruise tracks CAVASSOO 2001 – 2003 EU project
Greening the oceans by iron fertilisationto combat global warming? Iron & tracer Courtesy Sue Turner (UEA)
High nutrients Nitrate 0 5 10 15 20 25 µM [after Conkright et al., 1998]
Chlorophyll a (mg/m3) 50.0 10.0 2.0 0.5 0.1 0.01 Low chlorophyll Only the Southern Ocean has a potential for long term CO2 storage by iron fertilisation (circulation). (6 years of NASA SeaWiFS data, DAAC/GSFC, ORBIMAGE)
DMS and climate Sulphate Aerosol H2SO4 Radiation Budget SO2 DMS Algae DMS Degradation/Loss DMS = dimethyl sulphide
Greening the oceans to combat global warming? Poorly known efficiency of CO2 storage. Warming by the production of the greenhouse gases N2O and CH4 could outweigh cooling by CO2 storage (Jin and Gruber, 2002). Climate feedbacks by the production of DMS, halocarbons and alkyl nitrates. Unknown, major shifts in the marine ecosystem.
The oceanic carbon cycle in a changing climate The oceans absorb 27% of anthropogenic CO2 emissions. Strong feedbacks in the marine carbon cycle will reduce oceanic CO2 uptake relative to the increase in atmospheric CO2 for 2000-2100. Net oceanic CO2 uptake will reduce calcification and coral reef formation.
Drivers of GHG, Kaya identity* CO2 =(CO2 /E) x (E/GWP) x (GWP/P) x where • P = Population growth • GWP/P = Per capita gross world product • E/GWP = Energy requirement per unit of gross product • CO2 /E = CO2 emissions per unit of energy
Historical and future trends of drivers • CO2 emissions grew 1.7% (1900), double next 3 decades • Population grew 1.3% (1900), double ≥70 years • GWP grew 4% (1950), 3.5 to ≥32 times in 2100 • Weak relation population / economic growth • Primary energy consumption 2% (1900), will growth 1.3% • E. growth => capital turnover => less energy intensity; decarbonization
Key common trends • Exponential increase in LUC • Shift from biomass to fossil fuels • From LUC to fossil fuels as main proximate cause • Urbanization became major global driver of GHG (urban sprawl) • Key driver globalized trade dominated by few countries
Diverse regional pathways of development (1) Developed countries • Highest share of trade, production, energy use and emissions • Slow urban growth • High ecological footprint (8-15 times) • Decreased LUC • Higher ability to deal with mitigation/adaptation?
Diverse regional pathways of development (2) Two clusters: • During 1970-90 increased share of trade, production, energy and emissions, high urban growth, aggressive states • Industrialization, still dependant primary commodities, high urban growth, weak states, recurrent crisis Could first cluster have increased capacity for mitigation/adaptation strategies?
Diverse regional pathways of development (3) High primary commodity-export economies in Africa, Latin America and Asia with: • Insignificant participation in production, trade, energy and emissions • Vulnerable to vagaries of international markets and to climate vulnerability and change • Economic crisis and stagnation, segregation hamper promotion of carbon relevant policies
Portfolio of Technological Solutions • Deep cuts in • emissions require • advanced technologies • SOON • No single technology • can do it all • Some constraints Renewable Energy Technologies Hydrogen Fuel Cell Vehicles Bio-Fuels and Power Zero Net Emission Buildings Nuclear Power Generation IV Vision 21: Zero-Emission Power Plant Carbon (CO2) Sequestration
Portfolio of Biological Solutions • Can be implemented • immediately • Not long term solutions • Potential for ancillary • costs and benefits Sequestration in Ag. soils Plant New Forests Ocean Fertilization Reduced methane production Reduced deforestation
Multiple constraints on C mitigation options • Economics. • Social factors. • Institutional factors. • Institutional and timing aspects of technology transfer. • Demography. • Environmental requirements for other resources.
Potential mitigation with sustainability principles Effects of economic, environmental and social-institutional factors on the mitigation potential of a carbon management strategy Economical Factors Social and Institutions Environmental Factors Sustainably Achievable Potential Markets Social: Class structure Life style Trade Land, water, Biodiversity, Navigation and Fisheries rights Economic Structure Economic Structure Attitude Behavior Urbanization Institutional: Timing Cost of carbon ($/tCeq) Industrialization Politics Generation transfer Formal policies Informal rules Property rights Demographic: Technical Potential Density, growth Migration Spatial distribution Base Line Mitigation Potential Carbon Sequestered or GHG emissions avoided (tCeq)
Use of Wood Products Water Yield Biomass Energy Soil Fertility Erosion Prevention Recreational Value Biodiversity Conservation Development Regional Sustainable Land-based C mitigation options Win-win C sequestr. Biodiveresity Combat salinization C sequestration in Ag. Soil fertility Multiple-constraints Climate Mitigation Land-Based C Sequestration Projects
15-EU, sequestration in agricultural soils for the first Kyoto commitment period (2008-2012) could offset (Mt C yr-1) (Freibauer et al. 2003) Achievable potential 16-19 Theoretical potential ~90 100% 15% Theoretical vs. Achievable Potential Globally, enhanced terrestrial sequestration and energy cropping for the next 50 years could offset (Gt C yr-1) (Cannell 2003) Conservatively Achievable 0.2-1 Theoretical Potential 2-5 Realistic Potential 1-2 100% 10-20%
Conclusions • Vulnerability of carbon pools • The higher the CO2 concentrations the higher the risk of destabilizing vulnerable carbon pools (eg, permafrost, tropical peatlands). • Saturation of sink mechanisms • If NH sinks is largely due to forest regrowth, the sink strength will disappear within decades. Saturation of the CO2 fertilization effect on plan productivity occurs at around 600 ppm. • Inertia of the carbon cycle and energy systems • Even when anthropogenic CO2 emissions begin to decrease, atmospheric CO2 will continue to go up for up to a century. • Inertia of technology transfer • Sustainability criteria in sequestration and emission reduct. • Particularly on biological sequestration, realistically achievable potential is much less than theoretical potential.
Conclusions (ii) • Likely acceleration of climate change as the century progresses beyond what climate models are currently predicting. • Early action on carbon mitigation while terrestrial sinks are strong, and positive feedbacks are less likely.
International efforts on carbon cycle research Research Global Carbon Project & Partners Observations Integrated Global Observing Strategy Assessment IPCC
Global Carbon Project IGBP WCRP IHDP World Climate Research Program International Geosphere- Biosphere Program International Human Dimensions Program
National and regional carbon research programmes Canada Siberia CarboEurope North America Carbon Plan Jp China LBA SA Australia NZ
To develop comprehensive, policy-relevant understanding of the global carbon cycle, encompassing its natural and human dimensions and their interactions. GCP Objective www.globalcarboproject.org pep.canadell@csiro.au
Research activities • Urbanization pathways to minimize C emissions. • Attribution of terrestrial sinks to mechanisms. • Full carbon accounting methodologies. • Vulnerability of carbon pools on land and in oceans. • Model-data fusion approaches. • Coordination of ocean cruise programmes. • State-of-the-art synthesis of the carbon cycle. • Capacity building: institutes and summer courses. • Fostering integrated carbon research in LDC.
CarboEurope, Germany GHG CA, Italy IOC/SCOR-CO2 Panel Paris, France NIES,Tsukuba Japan (April 2004) Beijing, China USA Affiliate Off. CSIRO,Canberra Australia Affiliate Off. Proposed only GCP International Project and Affiliate Offices Inter.Proj.Off.