Download
1 / 17
170 likes | 268 Views
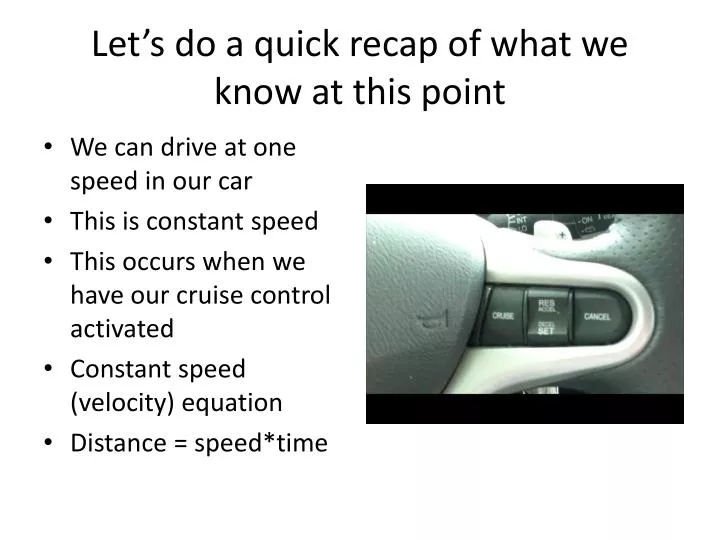
Let’s do a quick recap of what we know at this point. We can drive at one speed in our car This is constant speed This occurs when we have our cruise control activated Constant speed (velocity) equation Distance = speed*time . We created a distance-time graph.

E N D
Let’s do a quick recap of what we know at this point • We can drive at one speed in our car • This is constant speed • This occurs when we have our cruise control activated • Constant speed (velocity) equation • Distance = speed*time
We created a distance-time graph This is also called a position-time graph Time unit on the x axis Distance unit on the y axis • From this graph we used y = mx + b • Xf = v(t) + Xi • Slope is the speed or velocity • The intercept is the initial position. Often this is at a reference point or ‘0’. However, our object may have a head start!
But there are many objects whose speed changes with respect to time • This is an acceleration
Acceleration occurs when speed changes • Now we don’t want our cruise control on • We want to use our gas pedal or brake to make our car go faster or slower. • We could also coast and that would make our car go slower and slower.
We can plot our velocity changes on a velocity-time graph (speed-time) Speed-time for an object gaining 10 m/s each second (getting faster) When we get a line on this graph, we have a constant acceleration Slope of this line is the acceleration How fast equation Vf = Vi + a(t) Y intercept is the initial speed. Often this is zero but not always
So we are getting faster • This is obvious to you drivers, right? You can press on the gas and get the car to go faster and faster. • We now know that the speed of the car can be found using the how fast equation • Final speed based on: • Vf = Vi + a(t)
But what about ‘how far’ the car moves? • It turns out we can develop an equation for this, too. • This is the distance that the car moves • On my fit and on your car, you have an odometer which can help us measure distances we drive Odometer below the speedometer
If we made a distance-time graph now, it would appear curved
This shape is called a PARABOLA. We call this our ‘getting faster’ parabola because the car is getting faster
What does this parabola mean? • My distance is INCREASING over successive time intervals. • For example, if my car was traveling at 60 mph constant speed, every every hour I would travel 60 miles. • Now my distance doesn’t stay constant, it increases. • In the first second, I go 5 meters. In the next second, I go 15 additional meters, etc.
Top opening parabola • Complete equation of parabola • Ax2 + Bx + C = final position • In physics terms: • Xf = ½ (a)(t2) + Vi(t) + Xi • Acceleration is 2∙(‘A’ coefficient) • Use tangents
What about my car getting slower? This is acceleration, too, because my speed is changing. • Let’s say now I am traveling at an initial 50 units of speed (mph for example) and decrease my speed by 10 units every second
Look at our speed-time graph Still a linear function Now a negative diagonal • Now a negative slope or negative acceleration • Y-intercept represents the initial velocity • So, my how fast equation is: • Vf = Vi + a(t) or • Vf = 50 + (-10)(t)
What about how far? Parabola of car getting slower Parabola, too But it now has the opposite curvature See how it is different
What about ‘how far’ ‘Getting slower’ parabola A bottom opening parabola • Negative acceleration • Ax2 + Bx + C = final position • In physics terms: • Xf = ½ (a)(t2) + Vi(t) + Xi • Acceleration is 2∙(‘A’ coefficient) • For this object: • Xf = ½ (-10)(t2) + (50)(t) + 0 • Use tangents
We go less and less distance over successive time intervals In the first second, I go 45 meters In the next second, I go 35 additional meters. In the next second, I go 25 additional meters In the next second, I go 15 additional meters In the last second, I go 5 meters Isn’t the tangent line at 5 seconds a horizontal? Tangent lines imply speed. This would mean my car has stopped at 5 seconds.
So what types of motion can we do? • Now we have everything covered! * Car staying at one speed (constant speed) Car accelerating Getting faster Getting slower Using these two equations can help us: Xf= ½ (a)(t2) + Vi(t) + Xi (how far) Vf = Vi + a(t) (how fast)