Download
1 / 99
1k likes | 1.14k Views
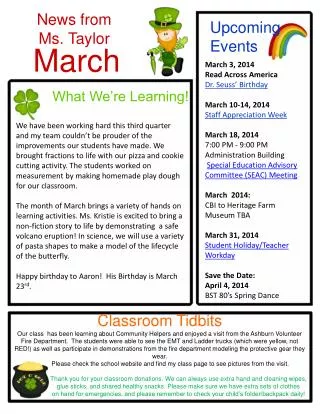
Results II (Figures) Numbers & Statistics Forestry 545 March 4 2014. Dr Sue Watts Faculty of Forestry University of British Columbia Vancouver, BC Canada sue.watts@ubc.ca. General manuscript format. Title Authors Abstract Introduction Materials & Methods Results Discussion

E N D
Results II (Figures)Numbers & Statistics Forestry 545 March 4 2014 Dr Sue WattsFaculty of ForestryUniversity of British Columbia Vancouver, BC Canada sue.watts@ubc.ca
General manuscript format • Title • Authors • Abstract • Introduction • Materials & Methods • Results • Discussion • References
Illustrations = Tables & Figures
Figures • Photographs • Drawings • Gazintas • Algorithms • Maps • Line graphs • Bar graphs • Pie charts • Pictographs
Figures • As with tables, figures should be independent and indispensable • Good visual material will spark reader interest • Interested readers will look to the text for answers
Figures • Need to be attractive but not glitzy • Watch out for size and scale (reduction may accentuate some flaws) • After reduction to publication size capital letters should be about 2 mm high • X and Y axis lines should be no wider than lettering
100 100 90 90 80 80 70 70 60 60 50 50 40 40 30 30 20 20 10 10 Avoid chart junk Local index Local index 0 0 1900 1905 1910 1915 1920 1900 1905 1910 1915 1920 Year Year Katz 2008
Figure captions • Reader looks at figures then legends • Title should explain meaning without need to read manuscript • Does not need to be a complete sentence • Like table title, usually in two parts • Descriptive title • Essential details
Figure captions • Captions for figures go below figure • In a manuscript, figure captions are placed on a separate sheet • How could you improve this caption and graph? Cumulative weeks to delivery of the women in group A (n =78) and group B (n = 78) Gustavii 2002
Improved caption & graph Gestational duration did not differ between the treated women and control Gustavii 2002
Figures • Photograph– used for documentary illustration • Drawing • Gazinta • Algorithm • Map • Line graph • Bar graph • Pie chart • Pictograph
Photograph • Value to article can range from Ø to more valuable than any text! • If you need a photo, pick a journal that produces high quality reproduction • Crop or mark with arrows to highlight important detail
Figures • Photograph • Drawing • Gazinta • Algorithm • Map – all used as explanatory artwork • Line graph • Bar graph • Pie chart • Pictograph
Drawing Can show perspective and detail (insides, layers) not possible with a photograph
Drawing allows control of detail Jamie Myers
Gazinta Visuals that show hierarchy, organization or interaction • Treegazintas show sub-assemblies of the same relative importance • Block diagrams are interaction gazintas
“Gazinta” (organization tree) ELECTRON MICROSCOPE LABORATORY TRANSMISSION EM SCANNING EM IMAGE PROCESSING TECHNICAL PERSONNEL SAMPLE SECTIONING SAMPLE STAINING A Typical drawing tree gazinta describes a relatively stable situation. Mathews and Mathews 2008
Algorithm • Flowcharts & taxonomic keys • Algorithms are illustrations of a means of making a decision by considering only those factors relevant to that decision • Algorithms are usually easier to follow than the written text equivalent
Flow chart algorithm About to receive a heartworm preventative for the first time… On a monthly macrolide heartworm preventative... Resuming a daily DEC preventative for the coming HW season… History and heartworm status unknown… WE NEED ANTIGEN TESTING PERFORM A HEARTWORM ANTIGEN TEST Is test positive? Is test negative? yes yes no yes Has dog been on a monthly heartworm preventative? Is there any history or clinical evidence to suggest heartworm infection? Examine blood with a Knotts or Filter test yes Are microfilariae present? no yes Suspect lapse in protection no no Dog is free from heartworm infection. May begin preventative regimen D. reconditum What kind? D. immitis Is there any history or clinical evidence to suggest heartworm infection? Dog has a heartworm infection. Evaluate extent of disease. Determine treatment protocol. Regard antigen test as false negative. no yes Suspect error in testing procedure. Repeat antigen test Begin further diagnostic procedures. yes Negative or uncertain results - retest Positive retest Retest in 3-6 months or contact test manufacturer for consultation no Is infection confirmed? Mathews and Mathews 2008
Figures • Photograph • Drawing • Gazinta • Algorithm • Map • Line graph • Bar graph • Histogram • Pie chart • Pictograph – all used to promote understanding of numerical results
Line graph Graphs are a good choice when you think that a relationship is more important to the reader than the actual numbers
Line graph • Line graphs, scatter graphs, bar graphs, histograms, pies and pictographs are used to promote understandingof numerical results • Tables present results • Graphs promote understanding of results and suggest interpretation of their meaning
Blood glucose levels Breakfast 300 250 200 150 100 50 0 Dinner Lunch Diabetic Blood Glucose Level (mg/dl) Normal (mg/dl*) 100.3 93.6 88.2 100.5 138.6 102.4 93.8 132.3 103.8 93.6 127.8 109.2 Diabetic (mg/dl) 175.8 165.7 159.4 72.1 271.0 224.6 161.8 242.7 219.4 152.6 227.1 221.3 Time (hour) midnight 2:00 4:00 6:00 8:00 10:00 noon 2:00 4:00 6:00 8:00 10:00 Normal 12:00 6:00 am 12:00 6:00 pm 12:00 Hour * decaliters/milligram Blood glucose levels for normal individual and diabetic Table or figure? Gustavii 2002
Line graph USA Canada Year Changes in rabies disease incidence over time. Mathews and Mathews 2008
Line graph labeling 100 100 Right eye Right eye Tyramine Tyramine 80 80 60 60 Pupil diameter (% change) Pupil diameter (% change) 40 40 Left eye Left eye 20 20 0 0 -20 -20 0 30 60 90 120 150 0 30 60 90 120 150 Minutes Minutes Gustavii 2002
Line graph symbols • Use standard symbols on line graphs (order below is suggested) • In some cases there can be symbolic use of symbols, i.e. filled circle for treatment and unfilled circle for the control Symbols for Line Graphs
Scatter graphs y y 16 16 14 14 12 12 10 10 8 8 6 6 4 4 2 2 0 0 x 0 2 4 6 8 10 12 14 16 0 2 4 6 8 10 12 14 16 x visible pattern no visible pattern Katz 2006
Bar graph • Used to present discrete (unrelated) variables in a forceful way • Downside is that they present a relatively small amount of information in quite a large space
Bar graph Consumption of pure alcohol (litres) Gustavii 2002
Comparative bar graph This effective bar graph relates insect type to turning choices. Mathews and Mathews 2008
Keep bar graph simple Do not use 3-D on 2-D data Gustavii 2002
Use 3-D only if necessary Jamie Myers
Histogram • An estimate of the probability distribution of a continuous variable • Used to present continuous variables in a forceful way
Comparative histogram Can replace legend with symbols Probability of dying in a coronary care unit after admission with initial working diagnosis of acute myocardial infarction. Gustavii 2002
Comparative histogram 6 M D K l o w N A h i g h N A 5 H i g h N a K H W C 4 pH 3 2 1 0 0 0 . 5 1 0 2 0 3 0 4 0 6 0 8 0 Time (min) Maximum three groups per category Gustavii 2002
Pie graph • Good for getting attention • Show relationship of a number of parts to the whole • Arrange segments in size order with largest at 12 o’clock • Downside is that you cannot compare areas
Pie graph Rose (5%) Violet (20%) Dandelion (50%) Apple (25%) Typical Honeybee Pollen Load Composition (n = 1,034 pellets) This effective divided-circle graph shows which flowers contribute to a typical honeybee pollen load. To help readers compare the proportions, percentages are included. Mathews and Mathews 2008
Pictograph Bar graphs made of pictures
Pictograph 110 75 65 55 1985 1990 1995 2000 Number of Flowering Plant Species in West Suffolk County In this effective pictograph, the length of the flower stems corresponds to the number of plant species. Mathews and Mathews 2008
Using statistics Using statistics properly is a skill Never be afraid to ask for advice Dr Tony KozakWednesdays 8:30 – 11:00 amFSC 2027 by appointment tony.kozak@ubc.ca
Descriptive statistics Usually want to reduce the volume of your data to a few characteristic numbers These characteristic numbers are descriptivestatistics Certaindescriptive statistics are particularly helpfulin your Results section
Common descriptive statistics • Size • Range • Middle • Mean • Mode • Median • Spread • Standard deviation • Central 50%