Download
1 / 41
420 likes | 542 Views
Environment by Numbers. Environmental Statistics and the ABS Michael Vardon Environment and Energy Statistics. Overview of presentation. About the ABS Environment by Numbers National Balance Sheet Salinity ABS information products and environment collections

E N D
Environment by Numbers Environmental Statistics and the ABS Michael Vardon Environment and Energy Statistics
Overview of presentation • About the ABS • Environment by Numbers • National Balance Sheet • Salinity • ABS information products and environment collections • Evolution of environmental statistics • Centre for Environment, Natural Resources, Energy and Sustainability Statistics (CENRESS) • Information Development Plan (IDP)
ABS Mission “We assist and encourage informed decision-making, research and discussion within governments and the community by providing a high quality, objective and responsive national statistical service”
ABS provides statistics on: Economy • National Accounts (e.g. GDP), Price indexes, Labour force Society • Population Census, Education, Indigenous people, Health and Welfare Environment
Aspects of data quality Some aspects to data quality • Accuracy and precision • Timely (how soon after the measurements is the data available) • Frequency (monthly, annual, 5-yearly) • Scale (local, regional, state, national) • Relevant (who uses the data and how is is used) • Fit-for-purpose
Environment by Numbers • Collection of 25 articles relating to the environment and sustainability • Most written by ABS staff, coordinated by Beth Edwards • All but one were contained in the ABS 2003 Year Book • Not intended to be comprehensive • Grabbed the attention of the media and policy departments
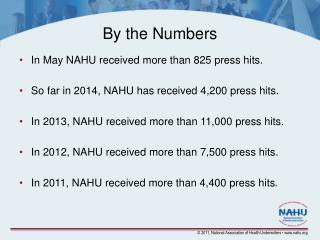
Environment by Numbers – Media focused on • Environmental views • decline in concern about environment from 75% in 1992 to 62% in 2001. Even bigger decline in 18-24 year olds (79% to 57%) • Salinity and farm management statistics
Environment by Numbers – Policy departments focused on • Also on salinity and farm management • Environmental Accounting and in particular the value of environmental assets on the National Balance Sheet
What is National Balance Sheet? Part of the System of National Accounts (SNA93) Estimates total economic assets (=wealth) Produced annually To be included on the balance sheet the item • must be an economic asset from which ownership rights are enforced by institutional units, individually and collectively • Must be an economic asset from which economic benefits may be derived by its owner from holding it, or using it, over a period of time.
Components of the balance sheet Produced assets • Buildings, machinery, livestock, plantation timber Non-produced assets • Land, subsoil, native forests, spectrum Financial assets • Bank deposits, shares, bonds, super
Two versions of the balance sheet Current price balance sheet • Uses actual prices in the period Volume balance sheet • Removes the effect of price changes • Australia the only nation with this
Principles of asset valuation Valuation should be market transaction based Where market prices are not available, two options • Perpetual inventory method • Net present value
Environmental assets • Land • Subsoil (minerals, fossil fuels, etc) • Timber (native and plantation)
Environmental Assets on the Australian National Balance Sheet (Chain Volume)
Land value and degradation (Chain volume - reference year 1998-99)
Land Management and Salinity Land Management and Salinity Survey 2002 • ~20,000 farmers surveyed in May 2002 • Response rate >90% • First results published in Salinity on Australian Farms, December 2002 • Re-published in Environment by Numbers • More information to come
Results Area of land showing signs of salinity • 2 million ha or 0.4% of agricultural land • WA largest area with 1.2 million hectares • WA and Vic. highest percentage of agricultural land (1.1%) Number of farms showing signs of salinity • 20,000 or 14% of all farms • 6,900 or 51% of WA farms
Current ABS environmental collections Energy Survey 2001/02 (one-off) Local Government Environment Protection Expenditure 2002/03 (annual) Household Survey - Transport and Waste March 2003 (annual survey with topics rotating over three years) Land Management Survey 2003/04 (biennial) Water Survey Agriculture 2002/03 (biennial)
Water Survey Agriculture • Discussion document available • Draft test form available • Consulting now underway
Other environmental publications • Environmental Issues: People’s Views and Practices, December 2002 • Australia’s Environment: Issues and Trends, July/August 2003 • Water Account Australia (2nd edition), October/November 2003
Water Account for Australia • 1st published 2000 • Presented information on water use by all industries, including agriculture • Underpinned much of the water data presented by the NLWRA • 2nd edition out in October/November 2003 • 2nd edition will provide some regional water data
Evolution of environment statistics • Compared to economic and social statistics a relatively new field • Frameworks and standards are evolving developing nationally and internationally • Have build up knowledge and can more clearly define information needs • The field is maturing and some hard monitoring and measurement issues are being addressed
International environmental agenda • 1987 Our Common Future – the Brundtland Commission Report • 1992 Rio “Earth Summit” and Agenda 21 • 2002 Jo’burg “Rio+10”
System of Integrated Economic and Environmental Accounting (SIEEA or SEEA) • First published 1993 • Revised SEEA 2002 (draft) • http://unstats.un.org/unsd/environment
The Australian environmental scene • 1992 Strategy for Ecologically Sustainable Development • 1996 and 2001 State of the Environment Reports • National Land and Water Resources Audit • 2002 Headline Sustainability Indicators report
National Statistical Service • ABS concept but ABS is only a part of the statistical service • Understand particular fields of statistics and ensure that collection activity matches information needs • ABS is at the centre of some fields (e.g. economic statistics) but not others (e.g.environment)
ABS’ niche in environment statistics • Still being defined • Contribute information • Have input to various committees and working groups • Centre for Environment, Natural Resources, Energy and Sustainability Statistics (CENRESS) • Information Development Plans
Centre for Environment, Natural Resource, Energy and Sustainability Statistics (CENRESS) • Service data users • Will coordinate and prioritise ABS input to environmental data collection • Will have an Advisory Board/Committee with representation from Commonwealth and State/Territory Agencies as well relevant experts and NGOs • First meeting planned for end of July
Information Development Plans • Understand data needs • Map current data supply • Bring the two closer together • Coordinate activity • Identify gaps • Assess priorities
Environment IDP • Many players supplying and using data • Complex subject matter • Many views of data needs • Many views on what priorities are • Desire to better coordinate and utilise existing resources • Draft IDP will be available in June
Summary • The ABS provides a range of statistics on economic, social and environmental issues • Not all of ABS data well known • The ABS is looking to coordinate and integrate its activity with others in the field of environment statistics, through CENRESS and the Environment IDP
Contact details Michael Vardon 02 6252 7348 michael.vardon@abs.gov.au Environment and Energy Section ABS House Belconnen Locked Bag 10 Belconnen 2616