Download
1 / 55
550 likes | 718 Views
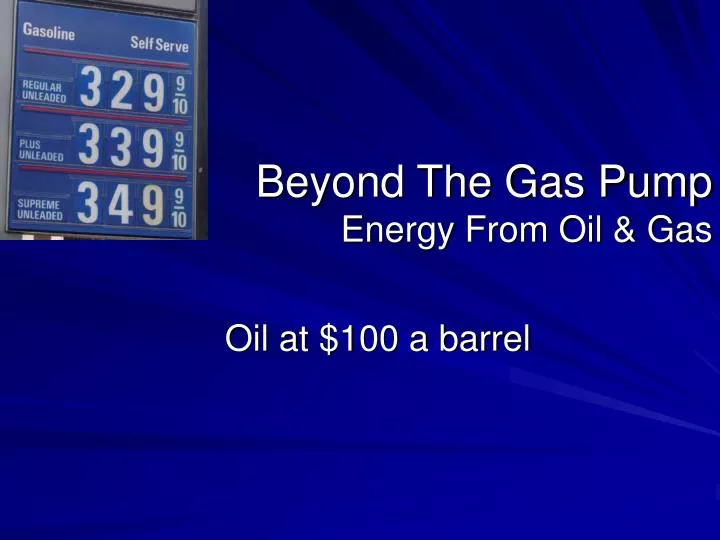
Beyond The Gas Pump Energy From Oil & Gas. Oil at $100 a barrel. Historical Energy Use by Type of Fuel (%). SPE 77506 – World Energy Beyond 2050, Arlie Skov. Significant Global Energy Events. 1970. OPEC Sets 55 percent Minimum Tax Rate (1970) U.S. Institutes Price Controls (1971)

E N D
Beyond The Gas PumpEnergy From Oil & Gas Oil at $100 a barrel
Historical Energy Use by Type of Fuel (%) SPE 77506 – World Energy Beyond 2050, Arlie Skov
Significant Global Energy Events 1970 OPEC Sets 55 percent Minimum Tax Rate (1970) U.S. Institutes Price Controls (1971) Arab Oil Embargo Against U.S. (1973) EPCA Authorizes Strategic Petroleum Reserve (1975) Windfall Profits Tax (1980) Iran/Iraq War – Oil Prices Doubled (1978-1980) World Oil Glut - $29 BBL Oil – U.S. Synfuels Shutdown (1983) Chernobyl Nuclear Accident (1986) Alaska’s Prudhoe Bay Production Peaks (1988) Iraq Invades Kuwait – Prices Soar ($36 BBL) (1990) Clean Air Act – Changes Gasoline & Diesel Fuels (1990) U.S. Imports More Oil & Refined Product Than It Produces (1993) Asian Financial Crisis – Oil Prices Plummet (1997-1998) German Government/Utilities Agree to Phase Out of Nuclear Power (2000) U.S. Petroleum Consumption – All Time High (19.7 Million BPD) (2001) Terrorist Attacks on the U.S. (2001) 1983 2001
Recent Global Energy Events 2004 Foreign Oil Dependence Rises to 65 percent (2004) Northeast Blackout Leaves 50 Million People in the Dark Natural Gas Prices Triple from 1990 Levels Oil Passes $50/Barrel Gasoline Exceeds $3/Gallon Hurricanes Damage Oil/Gas Rigs Venezuela Moves to Nationalize Resources Oil Breaks $75/Barrel Nigeria Kidnaps Oil Workers Experts State Oil Production May Have Peaked Iran Threatens Nuclear Capabilities Chad Orders Chevron to Leave BP Forced to Repair Pipeline Leaks China Extends Credit to Oil Nations Iran, Russia, Others Discuss Gas OPEC Texas Utilities Cancel 8 of 11 Coal Plants Oil Breaks $83/Barrel • $100.00 bbl OIL FEB. 2008 2005 2007
Just Over The Horizon…Forecasting Oil & Gas Supply • WSJ 7-10-07, “The industrialized world’s energy watchdog added to rising concerns in some quarters that oil and natural gas production won’t keep up with the world’s growing thirst for energy in coming years, highlighting worries over supplies and prices.” (Referencing the recently published International Energy Agency “Oil Market Report” )
A Significant Challenge • A SURGE: The surge in demand is expected to arise from rapid economic growth in such fast-developing countries as China and India, as well as mounting consumption in the U.S., the world's biggest energy market.” • Comments from the National Petroleum Council’s Draft Report, “Facing Hard Truths about Energy”, Bhushan Bahree, The Wall Street Journal 7-17-07
“Our Energy Future”Significant Issues of Interest/Importance • Enhancing The World’s Standard of Living • Alternative Fuels / Sources & Economics • Environmental Impact Issues • Consumption - Improving Energy Efficiency • Fueling The World’s Economic Growth • Supply Challenge – Fueling Economic Growth • Geo-politics
Commodities – Price & Value • Commodity Savy?? NYMEX Closing Prices 2/16/2008 • West Texas Intermediate Crude ($/bbl) • Natural Gas ($/Mcf) • Volumes • 1 Barrel = 42 gallons = 672 cups • 1 Mcf = 1000 Std. Cubic Feet @ Standard Temp (60F), Pressure (1atm) • Just for fun! • Grande Latte @ $3.50 (est. = 2 cups) • 1 Barrel “Latte” = 672/2 *$3.50 = $1176 • 1 Barrel of WTI = $99.15, 1 cup of WTI = $0.14 • Energy contained in 1 cup of crude oil? • Assume avg. Car Mileage 25 mpg... Equivalent of 1.6 miles/cup Oil = $99.15/bbl Gas = $6.38/mcf
Crude Oil 84-87% 11-14% 0.06-2% 0.1-2% 0.1-2% Natural Gas 65 – 80% 1-25% 0-0.2% 1-15% 0% Chemical Composition of Hydrocarbons Carbon Hydrogen Sulfur Nitrogen Oxygen
Petroleum Products A Barrel of Crude Oil Provides: Gasoline - 19.5 gallons One Barrel = 42 gallons Fuel Oil - 9.2 gallons Jet Fuel - 4.1 gallons Asphalt - 2.3 gallons Kerosene - 0.2 gallons Lubricants - 0.5 gallons Petrochemicals, other products - 6.2 gallons American Petroleum Institute, 2008
Petroleum Products Raw Natural Gas Components - Example Source: Midstream Primer: Oil & Gas Investor, July 2007
Petrochemical Products More Than 3,000 Products • Detergents - Cosmetics • Fertilizers - Weed Killers • Medicine - Antiseptics - Anesthetics • Plastics - Synthetic Fibers • Synthetic Rubber • Rust Preventatives • Liquid Petroleum Gas American Petroleum Institute, 2008
Historical Oil Prices – 2007 $ Real Oil Prices* Source:BP
Why High Oil Prices? • Driven by: • OPEC behaviour post 1999 • Strong demand growth 2004 • Low spare capacity • Geopolitics • Energy as a financial commodity World Oil Consumption Growth Mb/d Source:BP
Supply & Demand • Airline tickets • Stocks • Real Estate • I-Phone • In a free market – commodity prices are driven by the balance between supply and demand – For hydrocarbon fuels (oil and gas) the price equation is becoming evermore dominated by “supply” related challenges.
Oil & Gas Supply • Where did my last gallon of gas come from? • OPEC • The politics of oil • Control by NOC’s • Geopolitics • US • Exploration • Refinery Capacity • Weather
World Energy Consumption BP Statistical Review of World Energy – December 2007
Oil Consumption BP Statistical Review of World Energy – Jan. 2008
Major oil trade movements BP Statistical Review of World Energy – Jan 2008
Proved oil reserves at end 2006 BP Statistical Review of World Energy Dec. 2007
Remaining Oil?? BP Statistical Review of World Energy Dec. 2007
Proved Natural Gas Reserves BP Statistical Review of World Energy – Dec. 2007
Proved Coal Reserves 2006 BP Statistical Review of World Energy –Dec. 2007
Demand ChallengeOne Example - Fuel Economy • Overall fuel economy for cars and light trucks peaked at 22.1 mpg in 1987. Fell to 20.8 mpg in 2004. Avg. weight of vehicles has increased from 3200 lbs. to 4066 lbs. • Federal tax on gasoline = 18.4 cents/gallon • State tax varies (New York 60.8 to Alaska 26.4) • About 70% of new vehicles purchased in US have 6 cylinders + • 89% of vehicles in Europe have 4 cylinders or less (average fuel economy is 35 mpg) Wall Street Journal – “Fuel Economy Back in The Saddle”
A Sampling of What’s “Cool” About Oil & Gas Technology (eg. Deepwater – Jack) Co2 Flooding – Increasing Recoverable Oil Meeting the world’s needs Supplies Efficiency Environment Career Opportunities
Implications for U.S. and World Livestock, Poultry & Food Costs • U.S. supplies 2/3 of world corn exports, 20-25% of wheat & 35-40% of cotton exports • Cost of livestock & poultry feed will increase • Large increase in variability of feed & food costs • Food aid impacts? • Accelerated ag expansion into areas with fragile eco systems • Shift livestock industries from U.S. to South America? • Rural employment implications in U.S.
Ethanol Economics – new plants U. of Minn. 2007 costs • $0.10/gal. increase in ethanol price raises break-even Corn price $0.28/bu. • $1.00/bu. rise in corn price increases cost/gal. $0.36/gal.
Impact of Higher Crude Oil Price • Increased crude oil price by $10/barrel over the projection • Margins on ethanol plants increase • New incentive to invest in added capacity for ethanol production • Eventually, a new equilibrium reached where there is no incentive to invest in or exit the ethanol industry • Will demand for ethanol be enough? • E-10 market will saturate around 15 billion gallons • Drop in ethanol price will eventually encourage increase in demand for the flex-fuel cars
Major Countries with Ethanol Fuels • U.S. – likely production of 14-15 bil. gal. from corn in 3.5-5 years • Brazil –89 new ethanol plants to be built, 2007-2011 • 2% biodiesel mandate by 2008 & 5% by 2013 • EU-27 – 5.75% of motor fuel to be renewable • by 2010, 10% in 2020 • Canada – 5% ethanol mandate by 2010, 2% biodiesel by 2012 Biodiesel– Competition for crop land
International Impacts • U.S. ethanol plants under construction to use 58 mil. tons of corn (doubling use) • 3.5 times the volume of Japan imports of U.S. corn • 130% of 2006 EU corn crop • 70% of global corn exports • Strong negative impacts on animal & ag. • Higher food costs ahead • Major risk-management challenges in Ag. • & bioenergy
Need for Both Ethanol and Animal Agriculture • 100 million gallon ethanol plant – 37 million bushels of corn – 80 workers directly employed • 37 million bu corn Direct jobs Farrow - finish 800 Or Wean - finish 242 Or Beef feedlot 278 Source: Dr. John Lawrence, Head of ISU Beef Center