Download
1 / 64
690 likes | 1.21k Views
Non-renewable Energy Resources. Chapter 16. Essential Question #1. What types of energy resources exist, and to what extent do we use each type?. The Ultimate Source of Energy. Produces indirect forms of energy such as wind, hydropower & biomass. Examples of Energy Resources.

E N D
Non-renewable Energy Resources Chapter 16
Essential Question #1 What types of energy resources exist, and to what extent do we use each type?
The Ultimate Source of Energy Produces indirect forms of energy such as wind, hydropower & biomass.
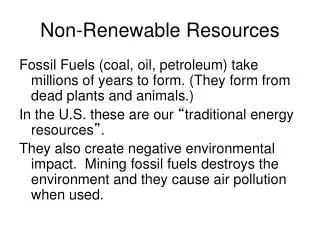
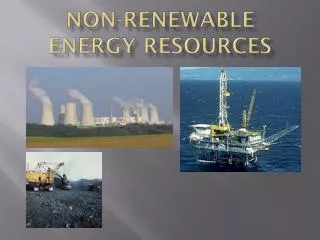
Examples of Energy Resources • Perpetual Resources • Solar Energy / Wind / Flowing Water • Renewable Resources • Biodiversity (biomass) • Nonrenewable Resources • Fossil fuels (coal / oil / natural gas) & nuclear
Commercial Energy Energy sold in the marketplace that meets our demands for energy not supplied by the sun (~1%).
Commercial Energy Sources 76% of commercial energy comes from non-renewable fossil fuels, 6% from nuclear & the rest from renewable sources.
Essential Question #2 What is net energy, how do we calculate it, and what energy systems have the highest net energy ratios?
First Law of Thermodynamics • Energy is not created or destroyed • Energy only changes form • Can’t get something for nothing • Energy input = Energy output
Energy Quality Relative Energy Quality (usefulness) Sources of Energy Energy Tasks Electricity Very high temperature heat (greater than 2,500°C) Nuclear fission (uranium) Nuclear fusion (deuterium) Concentrated sunlight High-velocity wind Very high-temperature heat (greater than 2,500°C) for industrial processes and producing electricity to run electrical devices (lights, motors) Very high High-temperature heat (1,000–2,500°C) Hydrogen gas Natural gas Gasoline Coal Food Mechanical motion (to move vehicles and other things) High-temperature heat (1,000–2,500°C) for industrial processes and producing electricity High Normal sunlight Moderate-velocity wind High-velocity water flow Concentrated geothermal energy Moderate-temperature heat (100–1,000°C) Wood and crop wastes Moderate-temperature heat (100–1,000°C) for industrial processes, cooking, producing steam, electricity, and hot water Moderate Dispersed geothermal energy Low-temperature heat (100°C or lower) Low-temperature heat (100°C or less) for space heating Low Fig. 2-10, p. 31
Second Law of Thermodynamics • In every transformation, some energy quality is lost • Cars: • only 20-25% gasoline produces useful energy • Ordinary light bulb: • 5% energy is useful light, rest is low-quality heat • Living systems: • quality energy lost with every conversion (Rule of 10)
Net Energy The usable amount of high-quality energy available from an energy resource Total Energy Available - Energy Used (1st Law) - Energy Automatically Wasted (2nd Law) - Energy Unnecessarily Wasted • to find, extract, process, & transporting to consumers = NET ENERGY
Net Energy Example If, out of every 10 units of energy from oil removed from the ground, 8 units of energy are used or wasted to find, extract, process, & transport that oil to users. The net energy would be 2 units of useful energy available for every 10 units extracted!
Net Energy Ratios • We express net energy as the ratio of useful energy produced to the energy used to produce it • The higher the ratio, the higher the net energy gain. • 10 / 8 = 1.25 • > 1 = net energy gain • < 1 = net energy loss
Space Heating Passive solar 5.8 Natural gas 4.9 Oil 4.5 Active solar 1.9 Coal gasification 1.5 Electric resistance heating (coal-fired plant) 0.4 Electric resistance heating (natural-gas-fired plant) 0.4 Electric resistance heating (nuclear plant) 0.3 High-Temperature Industrial Heat 28.2 Surface-mined coal Underground-mined coal 25.8 Natural gas 4.9 Oil 4.7 Coal gasification 1.5 Direct solar (highly concentrated by mirrors, heliostats, or other devices) 0.9 Transportation Natural gas 4.9 Gasoline (refined crude oil) 4.1 Biofuel (ethyl alcohol) 1.9 Coal liquefaction 1.4 Oil shale 1.2
Essential Question #3 Differentiate between the following types of non-renewable energy resources: oil, natural gas, coal, & nuclear energy.
OIL • Crude oil (petroleum) is a thick liquid containing hydrocarbons that we extract from underground deposits • Used for: • Transporting people & goods • Growing most of our food • Producing products like heating oil, plastics and asphalt.
OIL • Conventional Oil (light or sweet crude) • High Net Energy Yield • Unconventional Heavy Oil • Thick oil remaining in wells • Tar sands • Oil shale rock • Takes more energy & money to extract • Lowers Net Energy Yield
OIL • Refining crude oil: • Based on boiling points, components are removed at various layers in a giant distillation column. • The most volatile components with the lowest boiling points are removed at the top. Figure 16-5
Important Moments in Oil’s History • 1857 – First Commercial Oil Well, Pennsylvania • 1930 – Oil costs 10¢ per barrel • 1960 – OPEC is formed so developing countries with most of the world’s known oil and reserves can get a higher price for their oil • 1973-74: OPEC reduces oil imports to the west & bans oil exports to the U.S. b/c of their support of Israel in the Yom Kippur War. Oil prices rise sharply, causing double-digit inflation and global recession • 1981: Iran-Iraq war pushes global oil prices to a historic high • 1990-91: Persian Gulf War to protect U.S. access to Saudi Arabian & Kuwaiti oil supplies • 2004: Second Persian Gulf War begins • 2010-2030: world’s estimated oil reserves expected to peak
OIL • Eleven OPEC (Organization of Petroleum Exporting Countries) have 85% of the world’s proven oil reserves and most of the world’s unproven reserves. • After global production peaks and begins a slow decline, oil prices will rise and could threaten the economies of countries that have not shifted to new energy alternatives.
Global Peak Production The point in time when we reach the maximum rate of production globally Once we pass this point, rate of production declines If we continue using it faster than we can produce it, price rises There is disagreement over whether we have reached or will soon reach the global peak production of conventional crude oil. Geologists predict reserves of conventional crude will be 80% depleted between 2050 and 2100 depending on consumption
OIL • Inflation-adjusted price of oil, 1950-2006. Figure 16-6
Trade-Offs Conventional Oil Advantages Disadvantages Ample supply for 36–86 years Water pollution from spills & leaks 43% of global CO2 emissions / contributes to Climate Change High net energy yield, but decreasing Releases CO2 & other air pollutants when burned Lower land use than other energy resources Environmental costs not included in market price Artificially low price encourages waste and discourages search for alternatives Low cost (with huge subsidies) Need to find substitutes within 50 years Technology is well developed Easily transported within and between countries Vulnerable to international supply interruptions (OPEC) Efficient distribution system Potentially funds terrorist activities Fig. 16-7, p. 363
CO2 Emissions • CO2 emissions per unit of energy produced for various energy resources. Figure 16-8
Oil Sands & Oil Shale • Heavy and tarlike oils from oil sand and oil shale could supplement conventional oil, but there are environmental problems. • Oil sand is a mixture of clay, sand, water and combustible organic material called bitumen • Oil shales contain a solid combustible mixture of hydrocarbons called kerogen. • Extracting and processing produces: • Toxic sludge (stored in tailing ponds) • 3-5 times more greenhouse gases/ barrel than conventional oil • Uses & contaminates larges volumes of water • Requires large inputs of natural gas which reduces net energy yield.
Oil Sand Extraction Clear-cut forests, drain wetlands, divert rivers Remove overburden of soil, rocks, peat and clay Tar sands strip mined with power shovels Mixed with hot water & steam to extract bitumen Bitumen heated in huge cookers and converted to heavy crude for refining
Keystone XL Pipeline To import tar sand oil from Canada to Texas for refining
Oil Shales • Kerogen is processed into shale oil • Shale oil must be processed to remove sulfur, nitrogen & other impurities • Must be heated to increase flow rate to allow it to be sent by pipeline to a refinery • Even lower net energy than tar sands • Cannot compete in the open market without huge subsidies & tax breaks
Trade-Offs Heavy Oils from Oil Shale and Oil Sand Advantages Disadvantages Large potential supplies (especially oil sands in Canada) Low net energy yield Large amount of water needed for processing Easily transported within and between countries Severe land disruption Releases CO2 & other air pollutants when produced & burned Efficient distribution system in place Technology is well developed Severe water pollution Moderate cost (oil sand) High cost (oil shale)
NATURAL GAS • Russia and Iran have almost half of the world’s reserves of conventional gas, and global reserves should last 62-125 years. • Natural gas is versatile and clean-burning fuel, but it releases the greenhouse gases carbon dioxide (when burned) and methane (from leaks during extraction) into the troposphere.
Conventional Natural Gas • Natural gas is often found above reservoirs of crude oil. • When a natural gas-field is tapped, propane and butane gasses are liquefied and removed as liquefied petroleum gas (LPG). • The rest of the gas (mostly methane) is purified and pumped into pressurized pipelines for distribution
Unconventional Natural Gas • Coal Bed Methane Gas • Shale (limestone) Bed Methane Gas • Methane Hydrates • bubbles of methane trapped in ice crystals deep under the arctic permafrost and beneath deep-ocean sediments
Natural Gas Fracking (Hydraulic Fracturing) • Disadvantages: Scarring of the land, Large water use, Potential pollution of drinking water from aquifers, Seismic disruptions (earthquakes) 2005 Energy Policy Act excluded natural gas companies from regulation under U.S. water pollution control laws
Liquefied Natural Gas (LNG) • Natural gas can be converted to LNG at high pressure & low temperature • Allows for overseas transport • Low net energy yield • High energy used to liquefy, process, ship and reconvert it to natural gas
Trade-Offs Conventional Natural Gas Advantages Disadvantages Ample supplies (125 years) Difficult to transfer from one country to another High net energy yield Methane (a greenhouse gas) can leak from pipelines Lower CO2 emissions & other pollutants than other fossil fuels Releases CO2 and other air pollutants when burned Low cost (with huge subsidies) Shipped across ocean as highly explosive LNG Moderate environmental impact Sometimes burned off and wasted at wells because of low price or lack of available pipelines Easily transported by pipeline Low land use Good fuel for fuel cells and gas turbines Requires pipelines Low net energy yield for LNG
COAL • Coal is a solid fossil fuel that is formed in several stages as the buried remains of land plants that lived 300-400 million years ago.
Uses of Coal Burned in power plants to supply 42% of the world’s electricity Burned in industrial plants to make steel, cement and other products Highest Net Energy yield of nonrenewable energy resources
Coal Power Plant Waste heat Cooling tower transfers waste heat to atmosphere Coal bunker Turbine Generator Cooling loop Stack Pulverizing mill Condenser Filter Boiler Toxic ash disposal
COAL The Most Abundant Fossil Fuel • Could last 214 - 1,125 years depending on consumption rates • U.S. reserves could last 250 years at current consumption rate
COAL • The Dirtiest Fossil Fuel • Severely degrades land (mining) • Severe air & water pollution • Largest emitter of CO2 • Emits sulfur dioxide acid rain • Emits soot & fine particulates (PM 2.5) • Emits mercury & other toxic and radioactive particles • Produces highly toxic ash • Containing highly toxic chemicals like arsenic, cadmium, chromium, lead, mercury & radium
Toxic Coal Ash • Toxic coal ash is typically either buried (sometimes in abandoned mines) or made into a wet slurry & stored in surface holding ponds. • Both methods have the potential for leaks and groundwater contamination.
COAL • Coal is the most abundant fossil fuel, but compared to oil and natural gas it is: • not as versatile • has a high environmental impact • releases much more CO2 into the troposphere Figure 16-14
Clean Coal Technology? THERE IS NO SUCH THING AS “CLEAN COAL” • $40 million dollar publicity campaign funded by coal industry, electric utilities & railroad industry
Coal Synfuels • Coal can be converted into synthetic natural gas (SNG or syngas) and liquid fuels (such as methanol or synthetic gasoline) that burn cleaner than coal. • Costs are high& net energy lower • Requires mining 50% more coal • Burning them adds more CO2 to the troposphere than burning coal. • Requires high volumes of water
Coal Synfuels • Since CO2 is not regulated as an air pollutant and costs are high, U.S. coal-burning plants are unlikely to invest in coal gasification.
NUCLEAR ENERGY • When isotopes of uranium and plutonium undergo controlled nuclear fission, the resulting heat produces steam that spins turbines to generate electricity. • The uranium oxide consists of about 97% nonfissionable uranium-238 and 3% fissionable uranium-235 • The concentration of uranium-235 is increased through an enrichment process. • Enriched from natural 0.7% uranium-235 by removing uranium-238
NUCLEAR ENERGY Fissionable uranium-235 is processed into small pellets and packed into closed pipes called fuel rods. Fuel rods are grouped in fuel assemblies & placed in the core of the reactor Control rods move in and out of the core to absorb neutrons & control the rate of the reaction Water circulates as a coolant to prevent the core components from melting & releasing radioactivity A containment shell surrounds the core & protects from internal accidents and external threats
Small amounts of radioactive gases Uranium fuel input (reactor core) Control rods Containment shell Heat exchanger Turbine Steam Generator Electric power Waste heat Hot coolant Useful energy 25%–30% Hot water output Pump Pump Coolant Pump Pump Waste heat Cool water input Moderator Coolant passage Pressure vessel Shielding Water Condenser Periodic removal and storage of radioactive wastes and spent fuel assemblies Periodic removal and storage of radioactive liquid wastes Water source (river, lake, ocean) Fig. 16-16, p. 372