Download

1 / 25
250 likes | 449 Views
From Individual Demand to Consumer Surplus. Today: Deriving market demand from individual demand; using reservation prices to derive consumer surplus. Previously…. 7 core principles Thinking like economists Introduction to supply and demand Equilibrium

E N D
From Individual Demand to Consumer Surplus Today: Deriving market demand from individual demand; using reservation prices to derive consumer surplus
Previously… • 7 core principles • Thinking like economists • Introduction to supply and demand • Equilibrium • A route choice experiment and its equilibrium • Deriving individual demand
Today • Using individual demands to derive market demand • Reservation price • Consumer surplus
Recall individual demand • Last time, we went through the assumptions that gave us a downward-sloping individual demand curve • We will use “horizontal addition” to derive market demand from all individual demands
Example: Individual demand to market demand • Suppose Pat and Shannon have the following demand schedules for apples
Example: Individual demand to market demand • How do we get the market demand from individual demands? • We add them up
Some graphing reminders • Some reminders of graphs • Label axes • Label dollar amounts, quantities, etc. • To save space, all quantity numbers here are apples
How can we graph demand with only the graphs? • Another method of graphing total demand from individual demand is a method called horizontal addition • We horizontally add quantities demanded from each person AT A GIVEN PRICE
Price greater than $3 • When price is greater than $3, Shannon is the only person demanding a positive quantity • Thus, the top half of Shannon’s demand curve is the same as the market’s
Bottom half of the demand curve • At $3, 6 units are demanded • At $0, 21 units are demanded • Bottom half of demand curve connects (6, $3) and (21, $0)
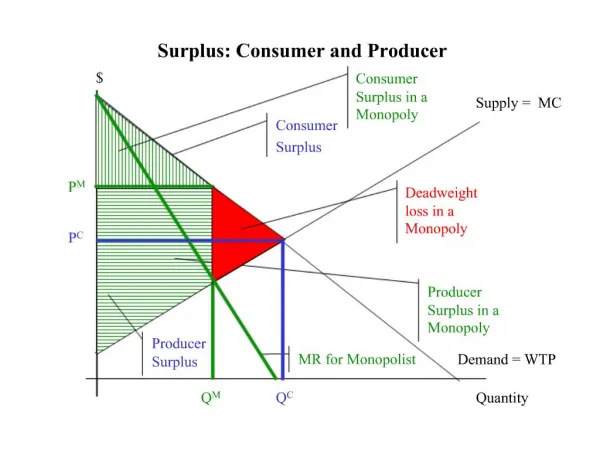
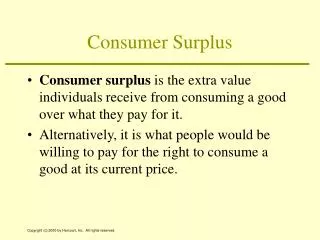
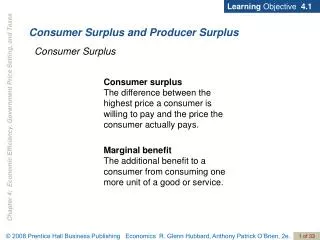
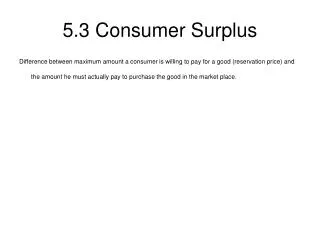
Reservation price and consumer surplus • How “well off” are we when we buy something? • Calculate consumer surplus by using demand curve and reservation price
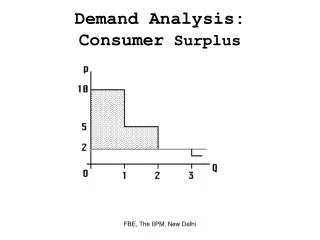
Reservation price • Reservation price is the highest price a person is willing to pay for a good or service • Note that reservation price for the nth unit corresponds to a particular point of a demand curve
Let’s return to part of Shannon’s demand • Shannon’s reservation price for 6th apple is $3
Core principle: Efficiency • Today, we calculate consumer surplus to help on our quest to efficiency
Calculating consumer surplus • Consumer surplus (CS) for the nth unit is the vertical difference between the demand curve and the price paid • We will calculate CS two ways • Discretely • Approximate using area under demand curve
If P = $3… • At P = $3, Shannon demands 6 apples • To calculate total consumer surplus for Shannon, we simply add CS for each unit purchased
CS for 6 units purchased • CS is the sum of the six dollar amounts in the right column, or $7.50
CS from demand curves • CS can be approximated by calculating the area under the demand curve and above the price The area of this triangle is a good approximation of CS
CS from demand curves • Height of triangle is ($6 – $3), or $3. • Length of triangle is (6 – 0), or 6 • Area of triangle is one-half times length times height • CS = $9 The area of this triangle is a good approximation of CS
This concludes demand • What have we learned? • How individual demand is derived • Utility • The rational spending rule • Deriving market demand from individual demand • Consumer surplus