Download
1 / 18
180 likes | 253 Views
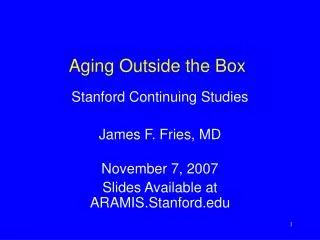
Aging Outside the Box. Stanford Continuing Studies James F. Fries, MD October 17, 2007. Class Schedule. General Themes October 17 – Longevity October 24 – Compression of Morbidity October 31 – Declining Disability

E N D
Aging Outside the Box Stanford Continuing Studies James F. Fries, MD October 17, 2007
Class Schedule • General Themes • October 17 – Longevity • October 24 – Compression of Morbidity • October 31 – Declining Disability • November l7 – Aging and Health Policy • December 5 – Synthesis and Application
Some Paradoxes of Life Span and Life Expectancy • Life expectancy increases more slowly at greater ages. • Life expectancy requires that a life is lived entirely in a single calendar year. • The term ‘Life Span’ is often used in the sense of “Maximum Life Span; ‘Maximal Average Life Expectancy’ is more appropriate for most issues. • Current trends in life expectancy cannot continue. • Life expectancy for a given person is not a constant: The longer you have lived the greater your estimated longevity.
Female Life Expectancy at 65 years:79>85 Male Female Life expectancy in years Male Life expectancy at birth: 48>78 1901 1910 1920 1930 1940 1950 1960 1970 1980 1990 2002 Life expectancy at birth and at 65 years of age by sex: United States, 1901-2002 Source: Centers for Disease Control and Prevention, National Center for Health Statistics, National Vital Statistics System. Chartbook on Trends in the Health of Americans / Health, United States 2005
I. Projecting Future Life Expectancy: U.S. Data 1900-2000 Source: Health, United States, 2006
II. Projecting Future Life Expectancy: U.S. Data 1980-2003 Source: Health, United States, 2006
III. Projecting Future Life Expectancy: U.S. Data 1980-2003 Source: Health, United States, 2006
CLUES AND CONJECTURES • Genetics and/or Environment • Super-Centenarians, Methuselah • Loss of Organ Reserve and Homeostasis • Soviet Georgia and Vilcabamba • Out-Migration, In-Migration • Declining Hormone Levels • Elevated Growth Hormone
CONJECTURESAND CLUES • The Fountain Myth • Cryogenics • Caloric Restriction • Breeding • Telomeres • Genomics, Amyloid • Anti-Oxidants, Notions and Potions